. 2008 Aug 15;321(5891):970-4.
doi: 10.1126/science.1159194.

In vivo imaging reveals an essential role for neutrophils in leishmaniasis transmitted by sand flies

Affiliations

In vivo imaging reveals an essential role for neutrophils in leishmaniasis transmitted by sand flies

Nathan C Peters et al. Science. .

Erratum in

  • Science. 2008 Dec 12;322(5908):1634

Abstract

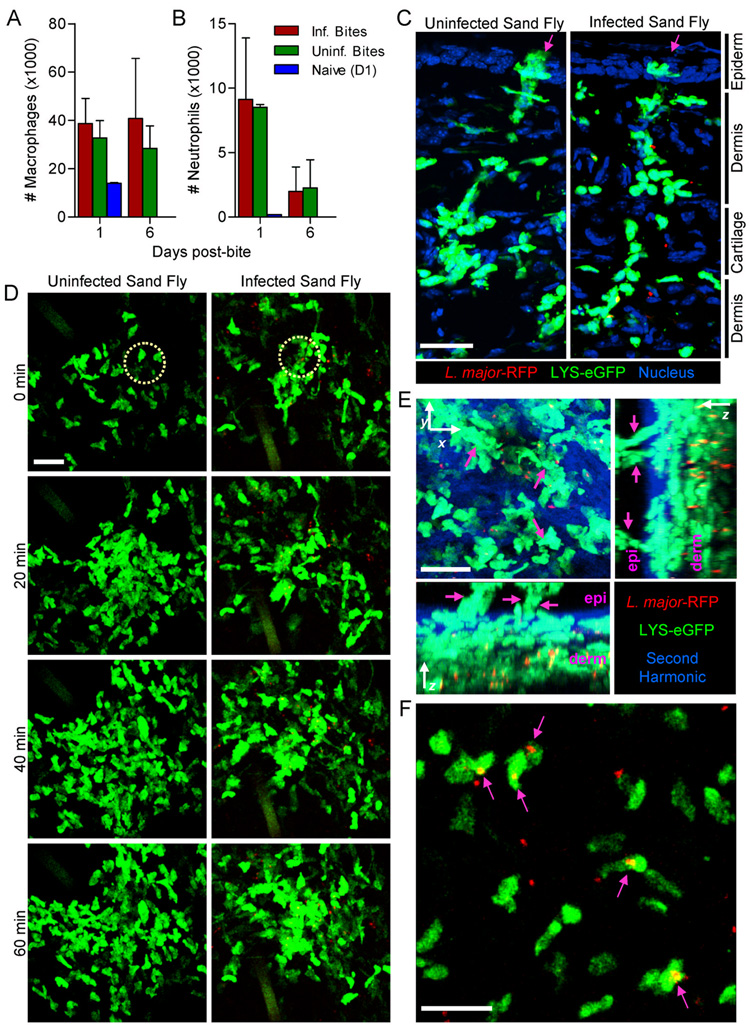
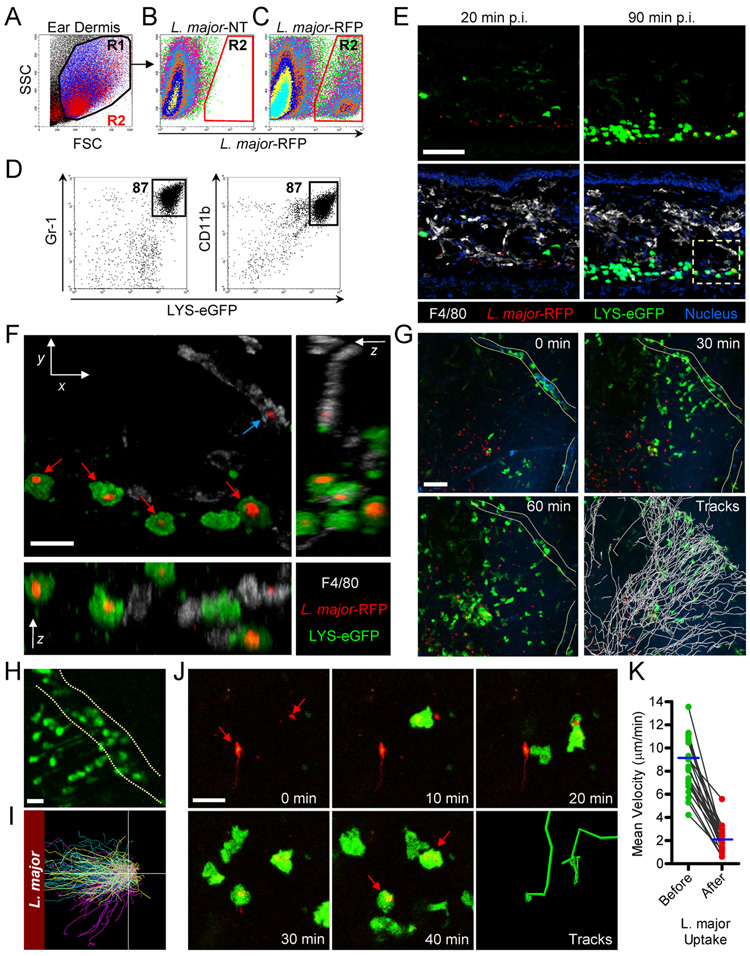
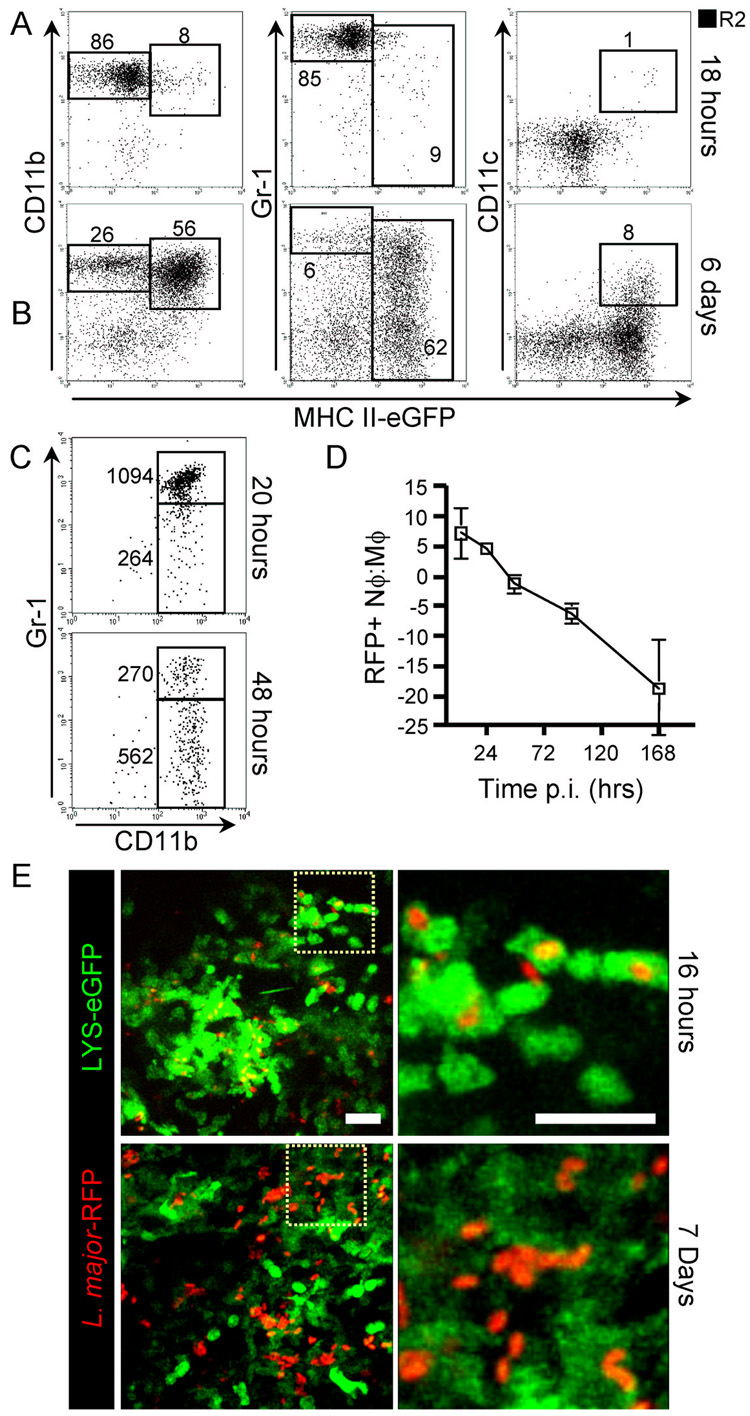
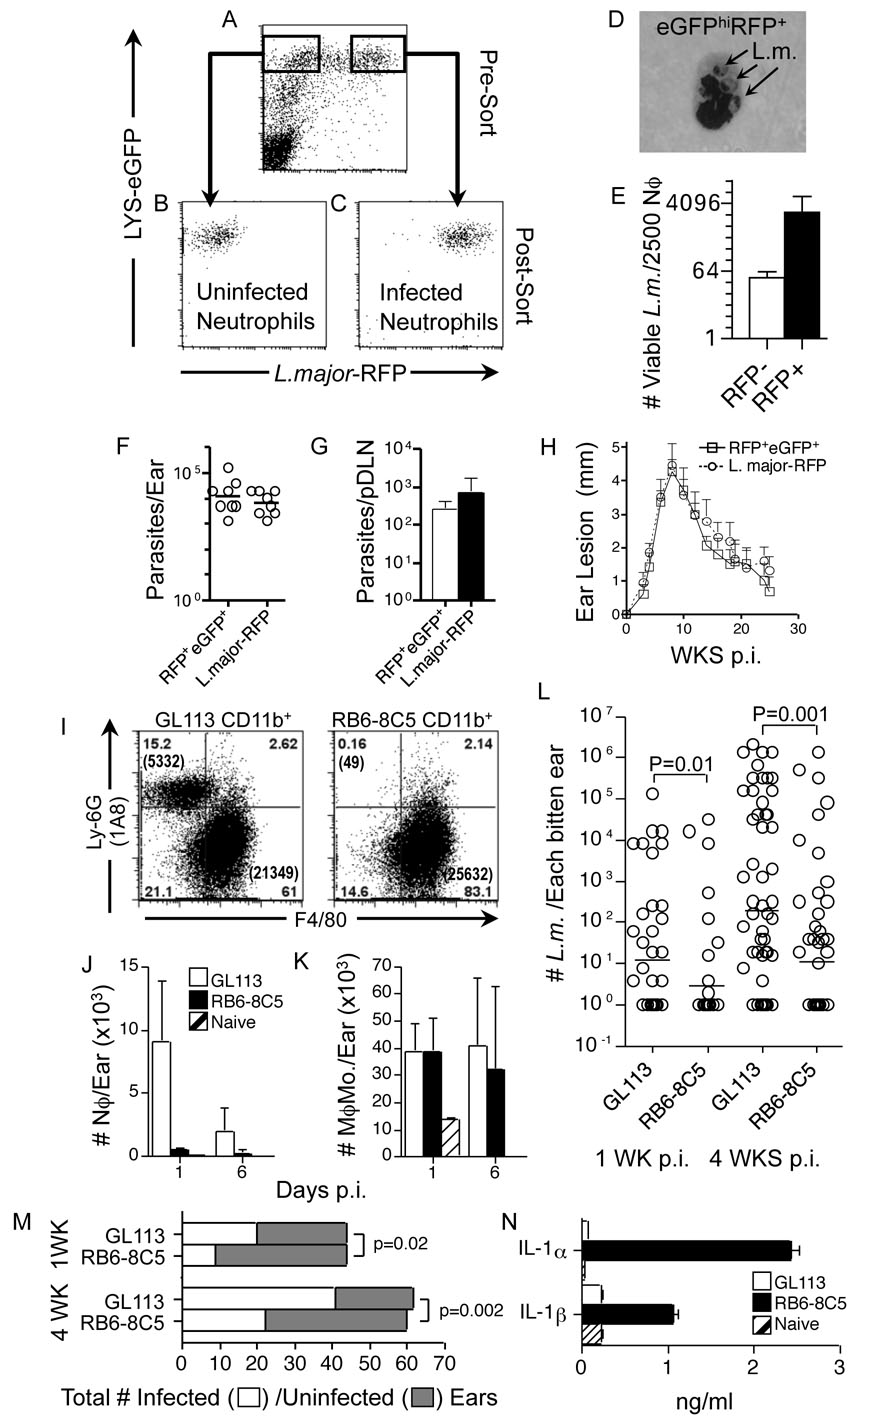
Infection with the obligate intracellular protozoan Leishmania is thought to be initiated by direct parasitization of macrophages, but the early events following transmission to the skin by vector sand flies have been difficult to examine directly. Using dynamic intravital microscopy and flow cytometry, we observed a rapid and sustained neutrophilic infiltrate at localized sand fly bite sites. Invading neutrophils efficiently captured Leishmania major (L.m.) parasites early after sand fly transmission or needle inoculation, but phagocytosed L.m. remained viable and infected neutrophils efficiently initiated infection. Furthermore, neutrophil depletion reduced, rather than enhanced, the ability of parasites to establish productive infections. Thus, L.m. appears to have evolved to both evade and exploit the innate host response to sand fly bite in order to establish and promote disease.


Figures

Figure 1
Figure 1. Neutrophils are rapidly recruited to sites of sand fly bite where they phagocytose L. major parasites
(A-B) Number of CD11b+F4/80+ macrophages/monocytes (A) and CD11b+Gr-1+7/4+F4/80MHCIILy6G+ neutrophils (B) recruited into the ear (+/− SD; n≥4 ears/group/day) 1 or 6 days after being bitten by infected or uninfected sand flies. The number of cells in a naïve mouse ear is shown for day 1. (C) Ear sections from LYS-eGFP mice (green) bitten with uninfected (left) or L.m.-RFP (red) -infected (right) sand flies 2 hours prior to harvesting tissue. Arrows point to sites of proboscis penetration. See also movies S1 and S2. (D) 2P-IVM time-lapse images from the ears of LYS-eGFP mice (green) beginning 40” after exposure to uninfected (left) or L.m.-RFP (red) -infected (right) sand files. Circles represent sites of sand fly proboscis penetration. (E) Maximum intensity projection images across X, Y, and Z dimensions derived from 2P-IVM of the ear of a LYS-eGFP mouse (green) 2 hours after exposure to L.m.-RFP (red) -infected sand flies. Dermal and epidermal layers defined by the presence or absence of collagen (blue), respectively, are indicated. Arrows point to sites of proboscis penetration and neutrophil “plug” formation. See also movies S3 and S4. (F) Image obtained from a 2P-IVM time-lapse series of the ear of a LYS-eGFP mouse (green) 3 hours after exposure to L.m.-RFP (red) -infected sand flies. Arrows point to neutrophils with one or more intracellular parasites. See also movies S5 and S6. Scale bars, 30µm (C–E), 20µm (F).
Figure 2
Figure 2. Rapid recruitment and infection of neutrophils following intradermal inoculation of L. major
(A) SSC/FSC dot plot of ear-derived cells 16 hours p.i. with 106 L.m.-RFP. (B and C) SSC/RFP dot plots of R1 gated ear cells 16 hours p.i. with 106 L.m.-empty vector control (B) or L.m.-RFP (C). (D) GFP, Gr-1, and CD11b expression by RFP+ R2 gated cells from ears of LYS-eGFP mice 2 hours p.i. with 5×10⁵ L.m.-RFP. (E) Ear sections from LYS-eGFP mice 20” (left) or 90” (right) p.i. with 1×10⁴ L.m.-RFP stained with F4/80 (white) and a nuclear dye (blue). Top panels show GFP and RFP images while bottom panels show a merge of all channels. (F) Maximum intensity projection images across X, Y, and Z dimensions from boxed region in part E. Red arrows indicate L.m.-RFP phagocytosed by neutrophils and blue arrow indicates a parasite captured by a macrophage‥ (G–K) LYS-eGFP animals were subject to 2P-IVM 30” p.i. with 1×10⁴ L.m.-RFP. (G) Time-lapse images showing GFP+ (green) cells, L.m.-RFP (red), and blood vessels (blue). Bottom right panel labeled “Tracks” shows the paths followed by cells from the vessel to site of inoculation of parasites over 60”. (H) Magnified view from part G showing neutrophil extravasation from vasculature. See also movies S7 and S8. (I) Cell migration paths from three independent experiments (cyan, yellow, and purple tracks) were normalized for their origin and their position relative to the site of parasite deposition. (J) Time-lapse images showing neutrophil (green) migration before and after phagocytosis of L.m.-RFP (red, arrows). (K) Neutrophil mean velocity 10” before and 10” after parasite phagocytosis. Data points represent individual cells and were compiled from 4 separate experiments. Scale bars, 50µm (E,G), 15µm (F,H,J).
Figure 3
Figure 3. L. major transitions from neutrophils to macrophages early after intradermal inoculation
(A-B) Dot plots gated on RFP+ cells (R2 in Fig. 2C) from ears of MHC II-eGFP mice taken at 18 hours (A) or 6 days (B) p.i. with 1×10⁶ L.m.-RFP. (C) CD11b and Gr-1 expression of RFP+-gated cells at 20 and 48 hours p.i. Numbers indicate the absolute number of gated cells per sample. (D) Mean of the ratio +/− SD of RFP+ infected neutrophils to RFP+ infected macrophages/ monocytes, n=4–6 individual ears per time point. (E) 2P-IVM projection images from the ears of LYS-eGFP mice (green) at 16 hours or 7 days p.i with 1×10⁴ L.m.-RFP (red). Images on right are magnified views of the boxed regions. Scale bars, 20µm.
Figure 4
Figure 4. Neutrophils harbour viable parasites and promote productive infections
(A-D) LYS-eGFPhi neutrophils from the ear 12 hours p.i. with 2.5×10⁶ L.m.-RFP were sorted into uninfected RFP (B) or L.m. infected RFP+ (C and D) populations. (B and C) Post-sort. (D) Dif-Quick stain of the cytospun GFP+RFP+ post-sort population. (E) Number of viable parasites per 2500 RFP and RFP+ neutrophils (+/− SD of triplicate samples). (F–H) Wt mice were injected in the ear with 103 culture-derived L.m.-RFP metacyclic promastigotes or 103 RFP+GFPhi infected neutrophils. Twenty-one days following injection mice were assessed for parasite load in individual ears (F), in pooled DLNs (G), and mean +/− SEM (n=8) ear lesion diameter over the course of infection (H). (I–N) Mice were treated with control (GL113) or neutrophil depleting antibody (RB6-8C5) 16 hours before exposure to infected sand flies. (I) Representative dot plot of CD11b+ gated Ly-6G+F4/80 neutrophils and Ly6GF4/80+ macrophages/monocytes on day 1 p.i. Analysis of the total number of CD11b+7/4+F4/80MHCIILy6G+ neutrophils (J) and CD11b+F4/80+ macrophage/monocytes (K), per ear +/− SD (n≥4/group/day), on day 1 and day 6 p.i. (L) Parasite loads in individual ears at 1 and 4 weeks following exposure to infected sand flies in GL113 versus RB6-8C5-treated animals as determined by limiting dilution analysis. Each open circle represents a single exposed ear in 3 (WK1) or 4 (WK4) pooled experiments. (M) Representation of the total incidence of infected versus uninfected ears in RB6-8C5 versus GL113 treated animals at 1 week (odds ratio =0.299, 95% CI (0.097, 0.847), p=0.020) and 4 weeks (odds ratio =0.293, 95% CI (0.126, 0.658), p=0.0017) post transmission as determined by limiting dilution analysis. (N) Spontaneous release of IL-α and β by ear derived cells as determined by multiplex cytokine analysis at 1 week p.i.

Comment in

Similar articles

Cited by

References

    1. Peters N, Sacks D. Immunol Rev. 2006;213:159. - PubMed
    1. van Zandbergen G, Solbach W, Laskay T. Autoimmunity. 2007;40:349. - PubMed
    1. Segal AW. Annu Rev Immunol. 2005;23:197. - PMC - PubMed
    1. Nauseef WM. Immunol Rev. 2007;219:88. - PubMed
    1. Belkaid Y, et al. J Immunol. 2000;165:969. - PubMed

Publication types

MeSH terms