

Glucose replacement to euglycemia causes hypoxia, acidosis, and decreased insulin secretion in fetal sheep with intrauterine growth restriction
- PMID: 18704001
- PMCID: PMC2678008
- DOI: 10.1203/PDR.0b013e318189358c
Glucose replacement to euglycemia causes hypoxia, acidosis, and decreased insulin secretion in fetal sheep with intrauterine growth restriction
Abstract
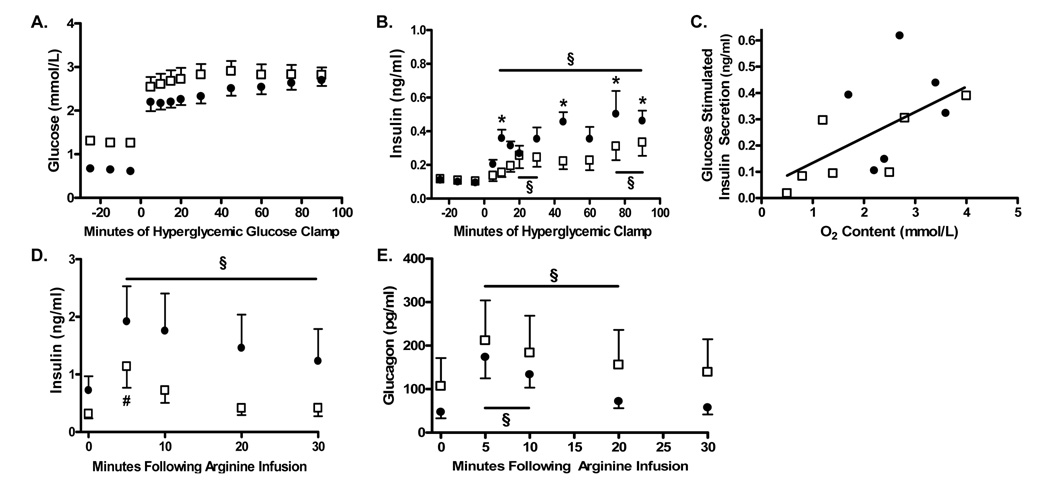
Nutritional interventions for intrauterine growth restriction (IUGR) have raised concerns for fetal toxicity, the mechanisms of which are unknown. Most of these attempts did not aim to normalize fetal metabolic conditions. Therefore, we used a model of IUGR to determine whether normalization of fetal hypoglycemia for 2 wks would be tolerated and increase insulin concentrations and pancreatic beta-cell mass. IUGR fetuses received either a direct saline infusion (Sal, the control group) or a 30% dextrose infusion (Glu) to normalize glucose concentrations. Neither insulin concentrations (0.11 +/- 0.01 Glu vs. 0.10 +/- 0.01 ng/mL Sal) nor beta-cell mass (65.2 +/- 10.3 Glu vs. 74.7 +/- 18.4 mg Sal) changed. Glucose stimulated insulin secretion (GSIS) was lower in the Glu group. Glu fetuses became progressively more hypoxic: O2 content 1.4 +/- 0.5 Glu vs. 2.7 +/- 0.4 mM Sal, p < 0.05. Partial pressure of carbon dioxide (Paco2) (53.6 +/- 0.8 Glu vs. 51.6 +/- 0.8 Sal, p < 0.05) and lactate (7.74 +/- 3.82 Glu vs. 2.47 +/- 0.55 mM Sal, p < 0.0001) were greater and pH lower (7.275 +/- 0.071 Glu vs. 7.354 +/- 0.003 Sal, p < 0.01) in the Glu group. We conclude that correction of fetal hypoglycemia is not well tolerated and fails to increase insulin concentrations or beta-cell mass in IUGR fetuses.
Figures


Similar articles
-
Reductions in insulin concentrations and β-cell mass precede growth restriction in sheep fetuses with placental insufficiency.Am J Physiol Endocrinol Metab. 2013 Mar 1;304(5):E516-23. doi: 10.1152/ajpendo.00435.2012. Epub 2012 Dec 31. Am J Physiol Endocrinol Metab. 2013. PMID: 23277186 Free PMC article.
-
Prolonged amino acid infusion into intrauterine growth-restricted fetal sheep increases leucine oxidation rates.Am J Physiol Endocrinol Metab. 2018 Dec 1;315(6):E1143-E1153. doi: 10.1152/ajpendo.00128.2018. Epub 2018 Sep 11. Am J Physiol Endocrinol Metab. 2018. PMID: 30205012 Free PMC article.
-
Chronically Increased Amino Acids Improve Insulin Secretion, Pancreatic Vascularity, and Islet Size in Growth-Restricted Fetal Sheep.Endocrinology. 2016 Oct;157(10):3788-3799. doi: 10.1210/en.2016-1328. Epub 2016 Aug 8. Endocrinology. 2016. PMID: 27501184 Free PMC article.
-
Fetal adaptations in insulin secretion result from high catecholamines during placental insufficiency.J Physiol. 2017 Aug 1;595(15):5103-5113. doi: 10.1113/JP273324. Epub 2017 May 26. J Physiol. 2017. PMID: 28194805 Free PMC article. Review.
-
Modeling intrauterine growth retardation in rodents: Impact on pancreas development and glucose homeostasis.Mol Cell Endocrinol. 2009 May 25;304(1-2):78-83. doi: 10.1016/j.mce.2009.02.019. Epub 2009 Mar 9. Mol Cell Endocrinol. 2009. PMID: 19433251 Review.
Cited by
-
Chronic anemic hypoxemia increases plasma glucagon and hepatic PCK1 mRNA in late-gestation fetal sheep.Am J Physiol Regul Integr Comp Physiol. 2016 Jul 1;311(1):R200-8. doi: 10.1152/ajpregu.00037.2016. Epub 2016 May 11. Am J Physiol Regul Integr Comp Physiol. 2016. PMID: 27170658 Free PMC article.
-
Reductions in insulin concentrations and β-cell mass precede growth restriction in sheep fetuses with placental insufficiency.Am J Physiol Endocrinol Metab. 2013 Mar 1;304(5):E516-23. doi: 10.1152/ajpendo.00435.2012. Epub 2012 Dec 31. Am J Physiol Endocrinol Metab. 2013. PMID: 23277186 Free PMC article.
-
Understanding the Long-Lasting Effects of Fetal Nutrient Restriction versus Exposure to an Obesogenic Diet on Islet-Cell Mass and Function.Metabolites. 2021 Aug 4;11(8):514. doi: 10.3390/metabo11080514. Metabolites. 2021. PMID: 34436455 Free PMC article. Review.
-
Real supermodels wear wool: summarizing the impact of the pregnant sheep as an animal model for adaptive fetal programming.Anim Front. 2019 Jul;9(3):34-43. doi: 10.1093/af/vfz018. Epub 2019 Jun 25. Anim Front. 2019. PMID: 31608163 Free PMC article. No abstract available.
-
Skeletal muscle protein accretion rates and hindlimb growth are reduced in late gestation intrauterine growth-restricted fetal sheep.J Physiol. 2018 Jan 1;596(1):67-82. doi: 10.1113/JP275230. Epub 2017 Oct 26. J Physiol. 2018. PMID: 28940557 Free PMC article.
References
-
- Resnik R. Intrauterine growth restriction. Obstet Gynecol. 2002;99:490–496. - PubMed
-
- Barker DJ, Hales CN, Fall CH, Osmond C, Phipps K, Clark PM. Type 2 (non-insulin-dependent) diabetes mellitus, hypertension and hyperlipidaemia (syndrome X): relation to reduced fetal growth. Diabetologia. 1993;36:62–67. - PubMed
-
- Illanes S, Soothill P. Management of fetal growth restriction. Semin Fetal Neonatal Med. 2004;9:395–401. - PubMed
-
- Say L, Gülmezoglu AM, Hofmeyr GJ. Maternal nutrient supplementation for suspected impaired fetal growth. Cochrane Database Syst Rev. 2003 CD000148. - PubMed
Publication types
MeSH terms
Substances
Grants and funding
- DK067393/DK/NIDDK NIH HHS/United States
- P30 DK057516/DK/NIDDK NIH HHS/United States
- 2 P30 DK048520-11/DK/NIDDK NIH HHS/United States
- L40 DK082250/DK/NIDDK NIH HHS/United States
- HD07186/HD/NICHD NIH HHS/United States
- HD28794/HD/NICHD NIH HHS/United States
- DK52138/DK/NIDDK NIH HHS/United States
- HD42815/HD/NICHD NIH HHS/United States
- R01 HD028794/HD/NICHD NIH HHS/United States
- RR00069/RR/NCRR NIH HHS/United States
- T32 HD007186/HD/NICHD NIH HHS/United States
- R01 HD042815/HD/NICHD NIH HHS/United States
- P30 DK048520/DK/NIDDK NIH HHS/United States
- R01 DK052138/DK/NIDDK NIH HHS/United States
- M01 RR000069/RR/NCRR NIH HHS/United States
- K01 DK067393/DK/NIDDK NIH HHS/United States
LinkOut - more resources
Full Text Sources
Other Literature Sources
Medical
