

Mutant screen distinguishes between residues necessary for light-signal perception and signal transfer by phytochrome B
- PMID: 18704165
- PMCID: PMC2494609
- DOI: 10.1371/journal.pgen.1000158
Mutant screen distinguishes between residues necessary for light-signal perception and signal transfer by phytochrome B
Abstract
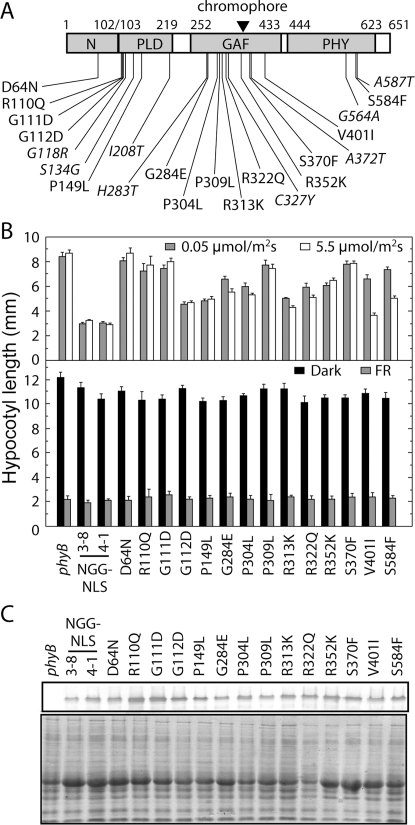
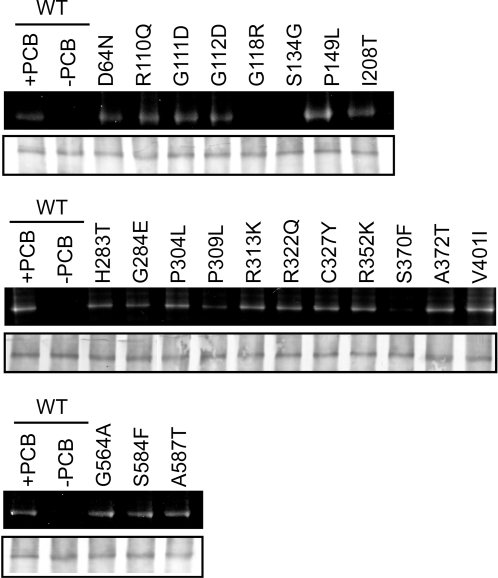
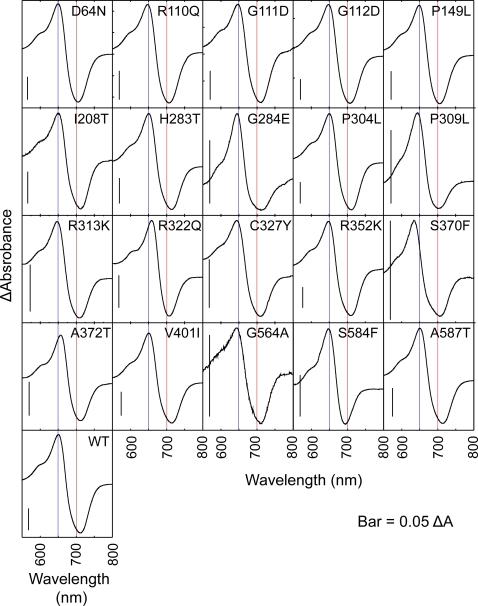
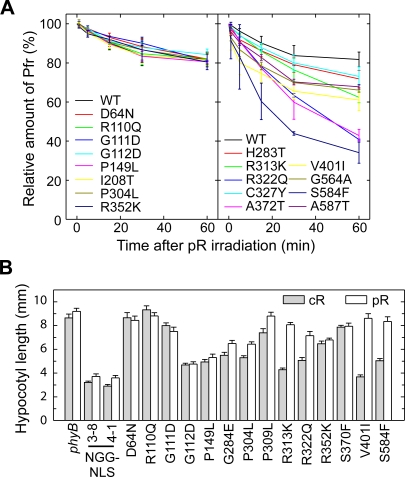
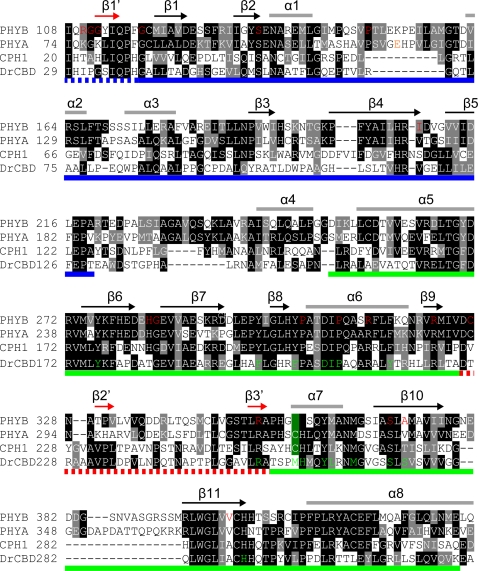
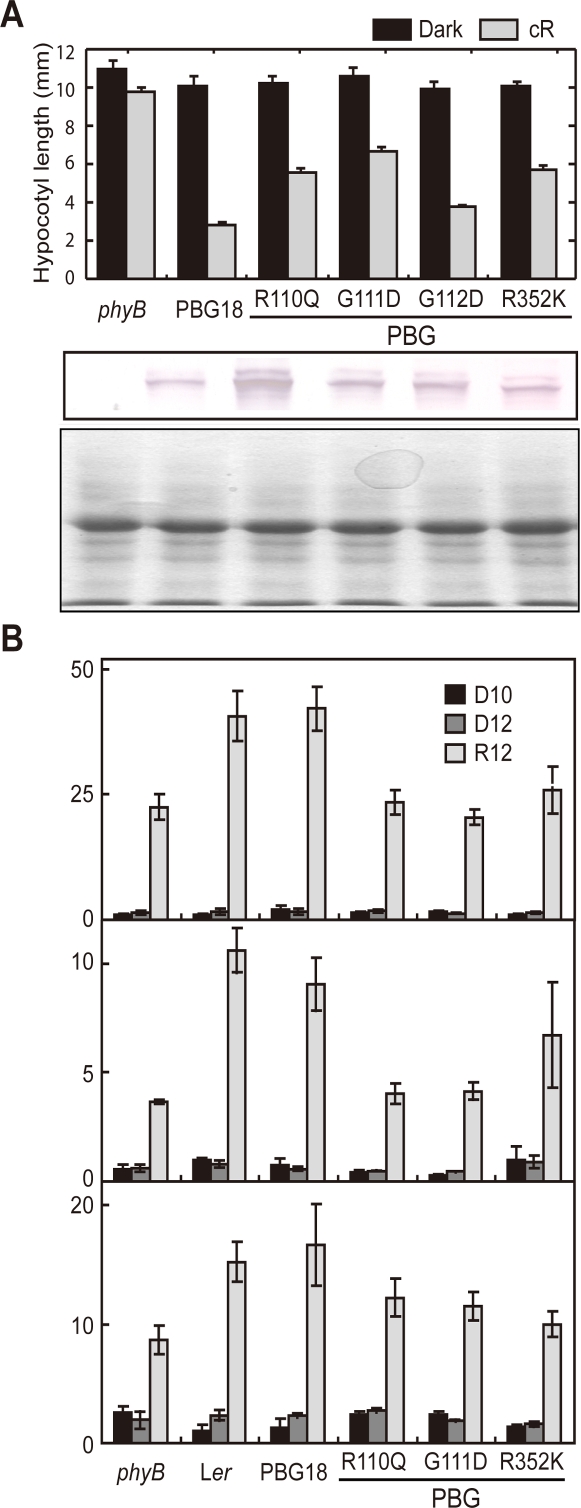
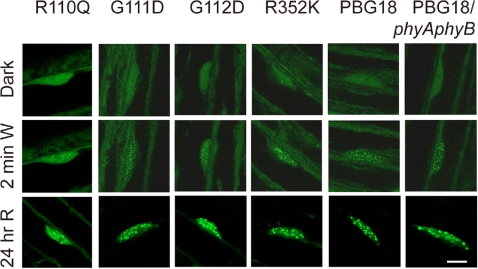
The phytochromes (phyA to phyE) are a major plant photoreceptor family that regulate a diversity of developmental processes in response to light. The N-terminal 651-amino acid domain of phyB (N651), which binds an open tetrapyrrole chromophore, acts to perceive and transduce regulatory light signals in the cell nucleus. The N651 domain comprises several subdomains: the N-terminal extension, the Per/Arnt/Sim (PAS)-like subdomain (PLD), the cGMP phosphodiesterase/adenyl cyclase/FhlA (GAF) subdomain, and the phytochrome (PHY) subdomain. To define functional roles for these subdomains, we mutagenized an Arabidopsis thaliana line expressing N651 fused in tandem to green fluorescent protein, beta-glucuronidase, and a nuclear localization signal. A large-scale screen for long hypocotyl mutants identified 14 novel intragenic missense mutations in the N651 moiety. These new mutations, along with eight previously identified mutations, were distributed throughout N651, indicating that each subdomain has an important function. In vitro analysis of the spectral properties of these mutants enabled them to be classified into two principal classes: light-signal perception mutants (those with defective spectral activity), and signaling mutants (those normal in light perception but defective in intracellular signal transfer). Most spectral mutants were found in the GAF and PHY subdomains. On the other hand, the signaling mutants tend to be located in the N-terminal extension and PLD. These observations indicate that the N-terminal extension and PLD are mainly involved in signal transfer, but that the C-terminal GAF and PHY subdomains are responsible for light perception. Among the signaling mutants, R110Q, G111D, G112D, and R325K were particularly interesting. Alignment with the recently described three-dimensional structure of the PAS-GAF domain of a bacterial phytochrome suggests that these four mutations reside in the vicinity of the phytochrome light-sensing knot.
Conflict of interest statement
The authors have declared that no competing interests exist.
Figures
Similar articles
-
Crystal structure of the photosensing module from a red/far-red light-absorbing plant phytochrome.Proc Natl Acad Sci U S A. 2014 Jul 15;111(28):10179-84. doi: 10.1073/pnas.1403096111. Epub 2014 Jun 30. Proc Natl Acad Sci U S A. 2014. PMID: 24982198 Free PMC article.
-
Arabidopsis phytochrome a is modularly structured to integrate the multiple features that are required for a highly sensitized phytochrome.Plant Cell. 2012 Jul;24(7):2949-62. doi: 10.1105/tpc.111.094201. Epub 2012 Jul 27. Plant Cell. 2012. PMID: 22843485 Free PMC article.
-
Roles for the N- and C-terminal domains of phytochrome B in interactions between phytochrome B and cryptochrome signaling cascades.Plant Cell Physiol. 2007 Mar;48(3):424-33. doi: 10.1093/pcp/pcm012. Epub 2007 Jan 23. Plant Cell Physiol. 2007. PMID: 17251203
-
Residues clustered in the light-sensing knot of phytochrome B are necessary for conformer-specific binding to signaling partner PIF3.PLoS Genet. 2009 Jan;5(1):e1000352. doi: 10.1371/journal.pgen.1000352. Epub 2009 Jan 23. PLoS Genet. 2009. PMID: 19165330 Free PMC article.
-
Integration of light and temperature signaling pathways in plants.J Integr Plant Biol. 2022 Feb;64(2):393-411. doi: 10.1111/jipb.13216. J Integr Plant Biol. 2022. PMID: 34984823 Review.
Cited by
-
Molecular mechanisms underlying phytochrome-controlled morphogenesis in plants.Nat Commun. 2019 Nov 19;10(1):5219. doi: 10.1038/s41467-019-13045-0. Nat Commun. 2019. PMID: 31745087 Free PMC article. Review.
-
Crystal structure of the photosensing module from a red/far-red light-absorbing plant phytochrome.Proc Natl Acad Sci U S A. 2014 Jul 15;111(28):10179-84. doi: 10.1073/pnas.1403096111. Epub 2014 Jun 30. Proc Natl Acad Sci U S A. 2014. PMID: 24982198 Free PMC article.
-
Functional analysis of PHYB polymorphisms in Arabidopsis thaliana collected in Patagonia.Front Plant Sci. 2022 Sep 7;13:952214. doi: 10.3389/fpls.2022.952214. eCollection 2022. Front Plant Sci. 2022. PMID: 36161012 Free PMC article.
-
Inhibition of arabidopsis hypocotyl elongation by jasmonates is enhanced under red light in phytochrome B dependent manner.J Plant Res. 2013 Jan;126(1):161-8. doi: 10.1007/s10265-012-0509-3. Epub 2012 Jul 25. J Plant Res. 2013. PMID: 22825635 Free PMC article.
-
Phytochrome B Requires PIF Degradation and Sequestration to Induce Light Responses across a Wide Range of Light Conditions.Plant Cell. 2018 Jun;30(6):1277-1292. doi: 10.1105/tpc.17.00913. Epub 2018 May 15. Plant Cell. 2018. PMID: 29764986 Free PMC article.
References
-
- Briggs WR, Christie JM. Phototropins 1 and 2: versatile plant blue-light receptors. Trends Plant Sci. 2002;7:204–210. - PubMed
-
- Briggs WR, Huala E. Blue-light photoreceptors in higher plants. Annu. Rev. Cell Dev. Biol. 1999;15:33–62. - PubMed
-
- Neff MM, Fankhauser C, Chory J. Light: an indicator of time and place. Genes Dev. 2000;14:257–71. - PubMed
-
- Mathews S, Sharrock RA. Phytochrome gene diversity. Plant Cell Environ. 1997;20:666–671.
-
- Quail PH, Boylan MT, Parks BM, Short TW, Xu Y, et al. Phytochromes,: photosensory perception and signal transduction. Science. 1995;268:675–680. - PubMed
Publication types
MeSH terms
Substances
Grants and funding
LinkOut - more resources
Full Text Sources
Molecular Biology Databases
