

Reproducibility of volumetric intravascular ultrasound radiofrequency-based analysis of coronary plaque composition in vivo
- PMID: 18704753
- PMCID: PMC2831183
- DOI: 10.1007/s10554-008-9338-9
Reproducibility of volumetric intravascular ultrasound radiofrequency-based analysis of coronary plaque composition in vivo
Abstract
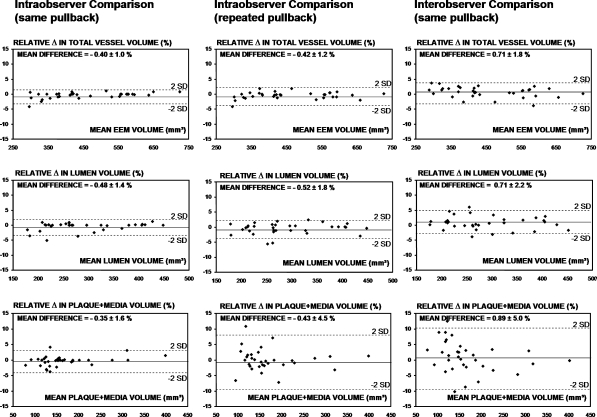
Intravascular ultrasound radiofrequency (RF-IVUS) data permit the analysis of coronary plaque composition in vivo and is used as an endpoint of ongoing pharmacological intervention trials. We assessed the reproducibility of volumetric RF-IVUS analyses in mild-to-moderately diseased atherosclerotic human coronary arteries in vivo. A total of 9,212 IVUS analyses on cross-sectional IVUS frames was performed to evaluate the reproducibility of volumetric RF-IVUS measurements in 33 coronary segments with a length of 27 +/- 7 mm. For vessel, lumen, and plaque + media volume the relative measurement differences (P = NS for all) were (A = intraobserver comparison, same pullback) -0.40 +/- 1.0%; -0.48 +/- 1.4%; -0.35 +/- 1.6%, (B = intraobserver comparison, repeated pullback) -0.42 +/- 1.2%; -0.52 +/- 1.8%; -0.43 +/- 4.5% (C = interobserver comparison, same pullback) 0.71 +/- 1.8%; 0.71 +/- 2.2%, and 0.89 +/- 5.0%, respectively. For fibrous, fibro-lipidic, calcium, and necrotic-core volumes the relative measurement differences (P = NS for all) were (A) 0.45 +/- 2.1%; -1.12 +/- 4.9%; -0.84 +/- 2.1%; -0.22 +/- 1.8%, (B) 1.40 +/- 4.1%; 1.26 +/- 6.7%; 2.66 +/- 7.4%; 0.85 +/- 4.4%, and (C) -1.60 +/- 4.9%; 3.85 +/- 8.2%; 1.66 +/- 7.5%, and -1.58 +/- 4.7%, respectively. Of note, necrotic-core volume showed on average the lowest measurement variability. Thus, in mild-to-moderate atherosclerotic coronary artery disease the reproducibility of volumetric compositional RF-IVUS measurements from the same pullback is relatively high, but lower than the reproducibility of geometrical IVUS measurements. Measurements from repeated pullbacks and by different observers show acceptable reproducibilities; the volumetric measurement of the necrotic-core shows on average the highest reproducibility of the compositional RF-IVUS measurements.
Figures


References
-
- Waters D, Craven TE, Lesperance J. Prognostic significance of progression of coronary atherosclerosis. Circulation. 1993;87:1399–1401.
-
- Ambrose JA, Tannenbaum MA, Alexopoulos D, Hjemdahl-Monsen CE, Leavy J, Weiss M, et al. Angiographic progression of coronary artery disease and the development of myocardial infarction. J Am Coll Cardiol. 1988;12:56–62. - PubMed
MeSH terms
LinkOut - more resources
Full Text Sources
Medical
Molecular Biology Databases
Miscellaneous
