. 2009 Aug;13(8B):2069-2082.
doi: 10.1111/j.1582-4934.2008.00470.x. Epub 2008 Aug 14.

Mycobacteria-induced granuloma necrosis depends on IRF-1

Affiliations

Mycobacteria-induced granuloma necrosis depends on IRF-1

Sahar Aly et al. J Cell Mol Med. 2009 Aug.

Abstract

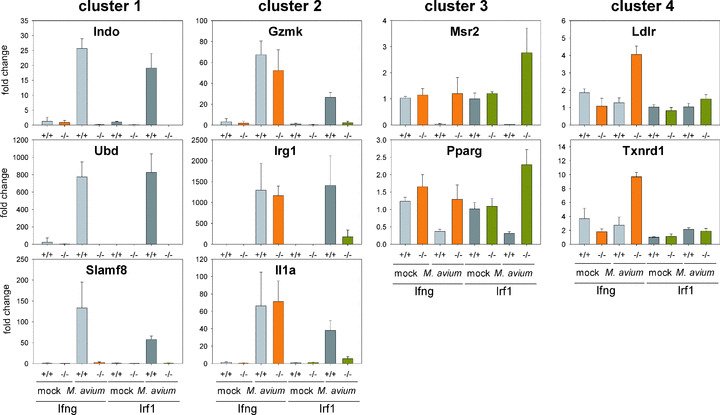
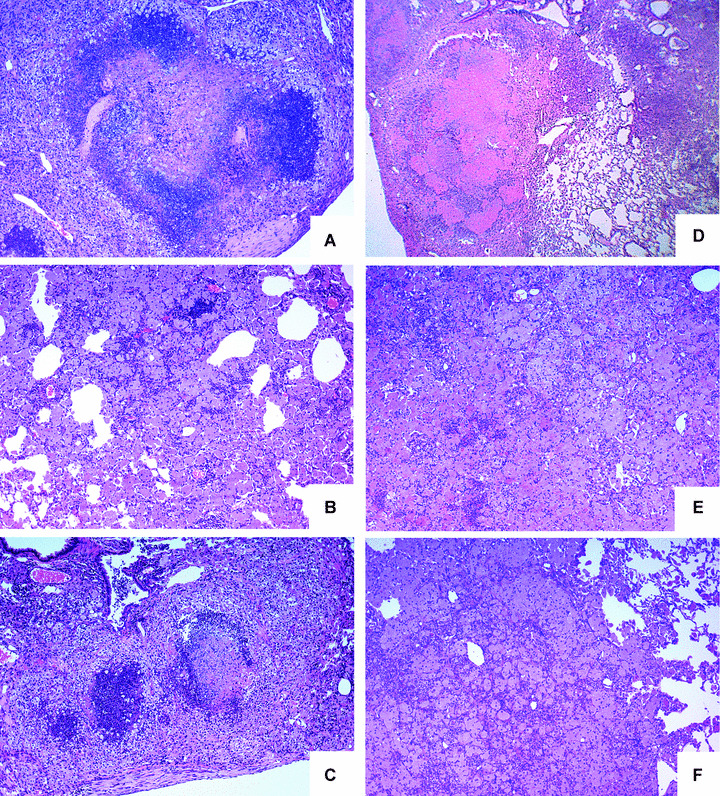
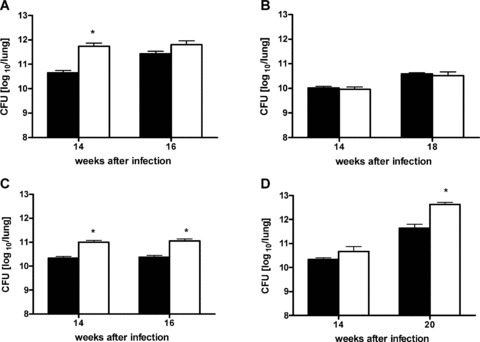
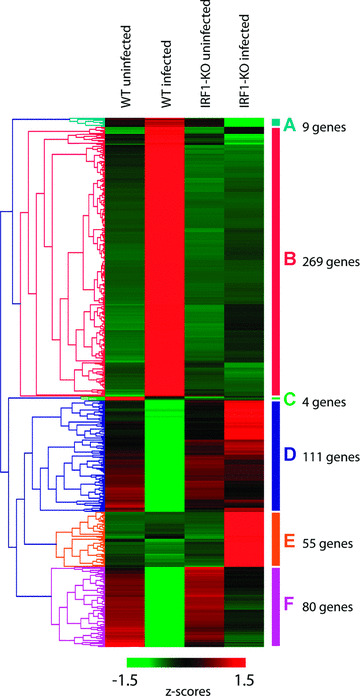
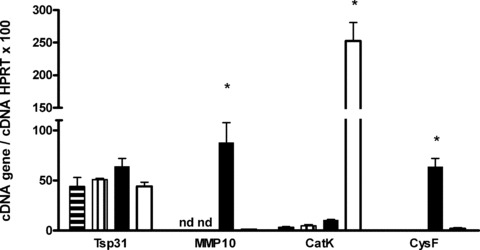
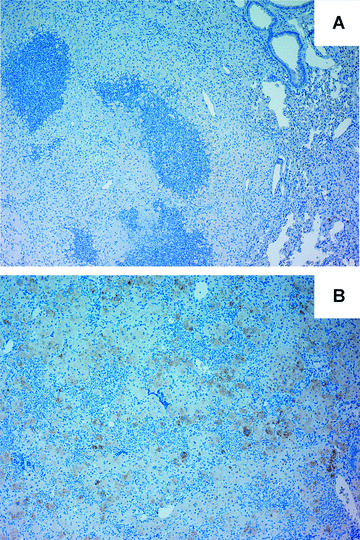
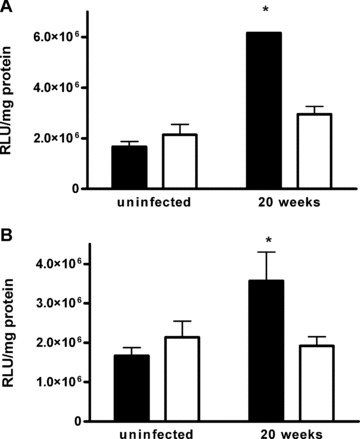
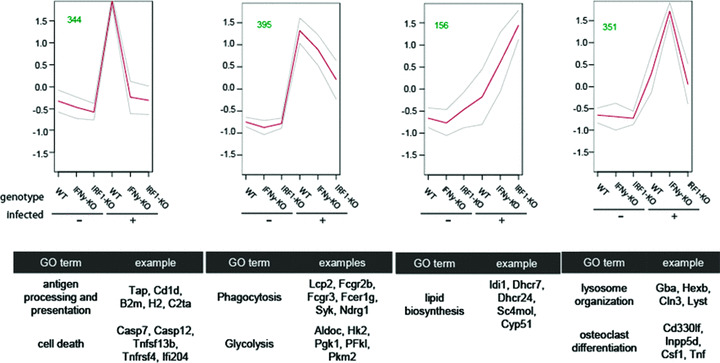
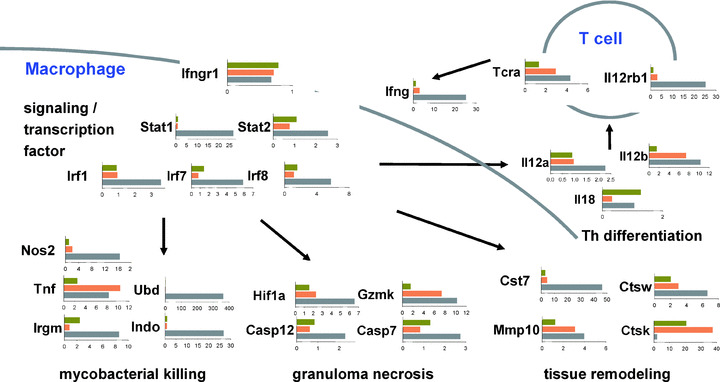
In a mouse model of mycobacteria-induced immunopathology, wild-type C57BL/6 (WT), IL-18-knockout (KO) and IFN-alphabeta receptor-KO mice developed circumscript, centrally necrotizing granulomatous lesions in response to aerosol infection with M. avium, whereas mice deficient in the IFN-gamma receptor, STAT-1 or IRF-1 did not exhibit granuloma necrosis. Comparative, microarray-based gene expression analysis in the lungs of infected WT and IRF-1-KO mice identified a set of genes whose differential regulation was closely associated with granuloma necrosis, among them cathepsin K, cystatin F and matrix metalloprotease 10. Further microarray-based comparison of gene expression in the lungs of infected WT, IFN-gamma-KO and IRF-1-KO mice revealed four distinct clusters of genes with variable dependence on the presence of IFN-gamma, IRF-1 or both. In particular, IRF-1 appeared to be directly involved in the differentiation of a type I immune response to mycobacterial infection. In summary, IRF-1, rather than being a mere transcription factor downstream of IFN-gamma, may be a master regulator of mycobacteria-induced immunopathology.


Figures

Figure 8
Figure 8
Validation of cluster assignment for dependence on IFN‐γ or IRF‐1 by qRT‐PCR. Lung RNA harvested from controls (mock) and 14 week infected WT/IFN‐γ+/+ (light grey), IFN‐γ‐KO (orange), WT/IRF‐1+/+ (dark grey) or IRF‐1‐KO (olive) mice was analysed for changes in expression of selected genes from clusters 1–4 according to Fig. 7. Expression was normalized to HPRT levels, using the WT/IRF‐1+/+ uninfected condition as a calibrator (fold change, FC = 1). Shown are mean + S.D. from six data points (three RNAs from individual mice, with 2 PCR replicates each).
Figure 1
Figure 1
Granuloma morphology in interferon pathway deficient mice. Histopathologies shown are from C57BL/6 (A), STAT‐1‐KO (B), IFN‐αβ‐R‐KO (C), IL‐18‐KO (D), IFN‐γ‐R‐KO (E) and IRF‐1‐KO (F) mice infected with M. avium (TMC724, 105 CFU/mouse) by aerosol. M. avium‐infected lungs were removed 16 weeks after infection from WT, STAT‐1‐KO and IFN‐γ‐R‐KO mice and after 20–24 weeks after infection in IFN‐αβ‐R‐Ko, IL‐18‐KO and IRF‐1‐KO mice. Lung sections were stained with haematoxylin and eosin (original magnification ×10). Micrographs are representative of four mice examined.
Figure 2
Figure 2
Bacterial loads in interferon pathway deficient mice. Mice were infected with M. avium by aerosol in separate experiments, each with its own WT control strain, and killed at indicated time‐points to determine mycobacterial loads in the lung. (A) C57BL/6 (black bars), STAT‐1‐KO (white bars); (B) C57BL/6 (black bars) and IFN‐αβ‐R‐KO (white bars); (C) C57BL/6 (black bars), IFN‐γ‐R‐KO (white bars) and (D) C57BL/6 (black bars) and IRF‐1‐KO (white bars). Data represent the means of four mice ± S.D. *P < 0.01 at a confidence level of 99%.
Figure 3
Figure 3
Differential gene expression in the lungs of WT versus IRF‐1‐KO mice. WT and IRF‐1‐KO mice were infected by aerosol with M. avium (TMC724, 105 CFU/mouse). Total RNA was prepared from the right lungs harvested 14 weeks after infection as well as from the right lungs of uninfected mice, and processed for gene expression analysis via microarrays. This is a graphic representation of a cluster analysis including 528 genes regulated more than twofold between WT and IRF‐1 KO lungs infected with M. avium and significantly in a two‐way anova with the covariates infection status and genotype (q‐value < 0.01). Expression data from three animals per condition were z‐score normalized and analysed by hierarchical clustering. Each row in the heat map represents one probe set, the columns stand for the conditions tested. A red square indicates higher expression, a green square indicates lower expression relative to a row‐wise mean (black). The different groups (A)–(F) comprise genes regulated in a similar manner.
Figure 4
Figure 4
Differential expression of proteolytic enzyme mRNAs in the lungs of infected mice. C57BL/6 WT (black bars) and IRF‐1‐deficient (white bars) mice were infected by aerosol with M. avium (TMC724, 105 CFU/mouse). Total RNA was prepared from the right lungs harvested 14 weeks after infection (filled black and white bars) as well as from the right lungs of uninfected mice (horizontally or vertically striped bars). One‐microgram samples of total RNA from WT and KO mice were reverse transcribed to cDNA and amplified on a Light Cycler in parallel with a standard to calculate arbitrary units of expression. Gene expression levels for matrix metalloprotease 10 (MMP‐10), cathepsin K (CatK) and cystatin F (CysF) were normalized to HPRT levels and the ratio was multiplied by 100. Tetraspanin 31 (Tsp31) was used as an unregulated control in IRF‐1‐KO compared to WT mice. *P < 0.01.
Figure 5
Figure 5
Histopathology of infected mouse lungs. C57BL/6 (A) and IRF‐1‐KO (B) mice were infected by aerosol with M. avium (TMC724, 105 CFU/mouse). Twenty weeks after infection M. avium‐infected mice were killed and the lung was removed. Lung sections were stained with an anti‐cathepsin K antibody (original magnification ×20) and developed by the immunoperoxidase technique. Micrographs are representative of four mice examined.
Figure 6
Figure 6
Determination of MMP activity in lung homogenates of infected mice. C57BL/6 (black bars) and IRF‐1‐KO (white bars) mice were infected by aerosol with M. avium (TMC724, 105 CFU/mouse). Aliquots of lung homogenates were centrifuged at 300 ×g for 10 min. Equal amounts of the supernatants were incubated with the fluorogenic MMP peptide substrate Mca‐PLGL‐Dpa‐AR‐NH2 (A: Combined activity of MMP‐1, ‐2, ‐7, ‐8, ‐9, ‐12, ‐13, ‐14, ‐15) and Mca‐RPKPVE‐Nval‐WRK (Dnp)‐NH2 (B: combined activity of MMP‐3 and MMP‐10) at RT for 30 min. and subsequently analysed using a fluorescence microplate reader. The measured relative light units (RLU) were correlated to protein content in the lung homogenate and depicted as MMP activity [RLU/mg protein]).
Figure 7
Figure 7
Comparative transcriptome analysis of M. avium‐infected IRF‐1‐ and IFN‐γ‐deficient mouse lungs. C57BL/6, IRF‐1‐KO and IFN‐γ‐KO mice were infected by aerosol with M. avium (TMC724, 105 CFU/mouse) in two separate experiments, each with its WT control. Cel files from both experiments were normalized together using RMA. Regulated genes were identified by a combination of statistical testing (limma F‐test P < 0.0001) and absolute and relative changes in expression across all conditions (max‐min > 80, max/min > 3). The resulting 2278 probe sets were z‐score normalized and used for a k‐means cluster analysis. Shown are the four clusters containing genes that are up‐regulated in WT lungs after infection. Characteristic, significantly enriched GO biological process terms together with example genes are depicted below each cluster. Cluster 1 (top left): gene expression dependent on both IRF‐1 and IFN‐γ. Cluster 2 (top right): gene expression dependent on IRF‐1 but less on IFN‐γ. Cluster 3 (bottom left): overshooting gene expression mostly dependent on IRF‐1. Cluster 4 (bottom right): overshooting expression mostly dependent on IFN‐γ. Table S2 lists all probe sets and average expression data for clusters 1 to 4.
Figure 9
Figure 9
Schematic representation of the type I immune response in M. avium infection and its transcriptional perturbation in Irf1‐ and Ifnγdeficient mice. The pathway components of IFN‐γ induction, signalling and effector functions are shown and assigned to macrophages and T cells as the prime host and effector cells during mycobacterial lung infection. The assignment of genes to the different effector function groups is tentative. Regulation of gene expression during M. avium infection in WT and gene‐deficient mice is depicted as fold change relative to the respective uninfected control in bar plots (WT: grey bars; IRF‐1‐KO: olive bars; IFN‐γ‐KO: orange bars). The corresponding values are listed in Table S3.

References

    1. Ehlers S, Hölscher C. DTH‐associated pathology. In: Kaufmann SH, Steward MW, editors. Topley & Wilson’s microbiology and microbial infections: immunology. London : Hodder Arnold; 2005. pp. 705–29.
    1. Dheda K, Booth H, Huggett JF, et al . Lung remodeling in pulmonary tuberculosis. J Infect Dis . 2005; 192: 1201–9. - PubMed
    1. North RJ, Jung YJ. Immunity to tuberculosis. Annu Rev Immunol . 2004; 22: 599–623. - PubMed
    1. Ehlers S, Benini J, Held HD, et al . Alphabeta T cell receptor‐positive cells and interferon‐gamma, but not inducible nitric oxide synthase, are critical for granuloma necrosis in a mouse model of mycobacteria‐induced pulmonary immunopathology. J Exp Med . 2001; 194: 1847–59. - PMC - PubMed
    1. Benini J, Ehlers EM, Ehlers S. Different types of pulmonary granuloma necrosis in immunocompetent vs. TNFRp55‐gene‐deficient mice aerogenically infected with highly virulent Mycobacterium avium. J Pathol . 1999; 189: 127–37. - PubMed

Publication types