

Indole-3-acetic acid (IAA) biosynthesis in the smut fungus Ustilago maydis and its relevance for increased IAA levels in infected tissue and host tumour formation
- PMID: 18705875
- PMCID: PMC6640242
- DOI: 10.1111/j.1364-3703.2008.00470.x
Indole-3-acetic acid (IAA) biosynthesis in the smut fungus Ustilago maydis and its relevance for increased IAA levels in infected tissue and host tumour formation
Abstract
Infection of maize (Zea mays) plants with the smut fungus Ustilago maydis is characterized by excessive host tumour formation. U. maydis is able to produce indole-3-acetic acid (IAA) efficiently from tryptophan. To assess a possible connection to the induction of host tumours, we investigated the pathways leading to fungal IAA biosynthesis. Besides the previously identified iad1 gene, we identified a second indole-3-acetaldehyde dehydrogenase gene, iad2. Deltaiad1Deltaiad2 mutants were blocked in the conversion of both indole-3-acetaldehyde and tryptamine to IAA, although the reduction in IAA formation from tryptophan was not significantly different from Deltaiad1 mutants. To assess an influence of indole-3-pyruvic acid on IAA formation, we deleted the aromatic amino acid aminotransferase genes tam1 and tam2 in Deltaiad1Deltaiad2 mutants. This revealed a further reduction in IAA levels by five- and tenfold in mutant strains harbouring theDeltatam1 andDeltatam1Deltatam2 deletions, respectively. This illustrates that indole-3-pyruvic acid serves as an efficient precursor for IAA formation in U. maydis. Interestingly, the rise in host IAA levels upon U. maydis infection was significantly reduced in tissue infected with Deltaiad1Deltaiad2Deltatam1 orDeltaiad1Deltaiad2Deltatam1Deltatam2 mutants, whereas induction of tumours was not compromised. Together, these results indicate that fungal IAA production critically contributes to IAA levels in infected tissue, but this is apparently not important for triggering host tumour formation.
Figures

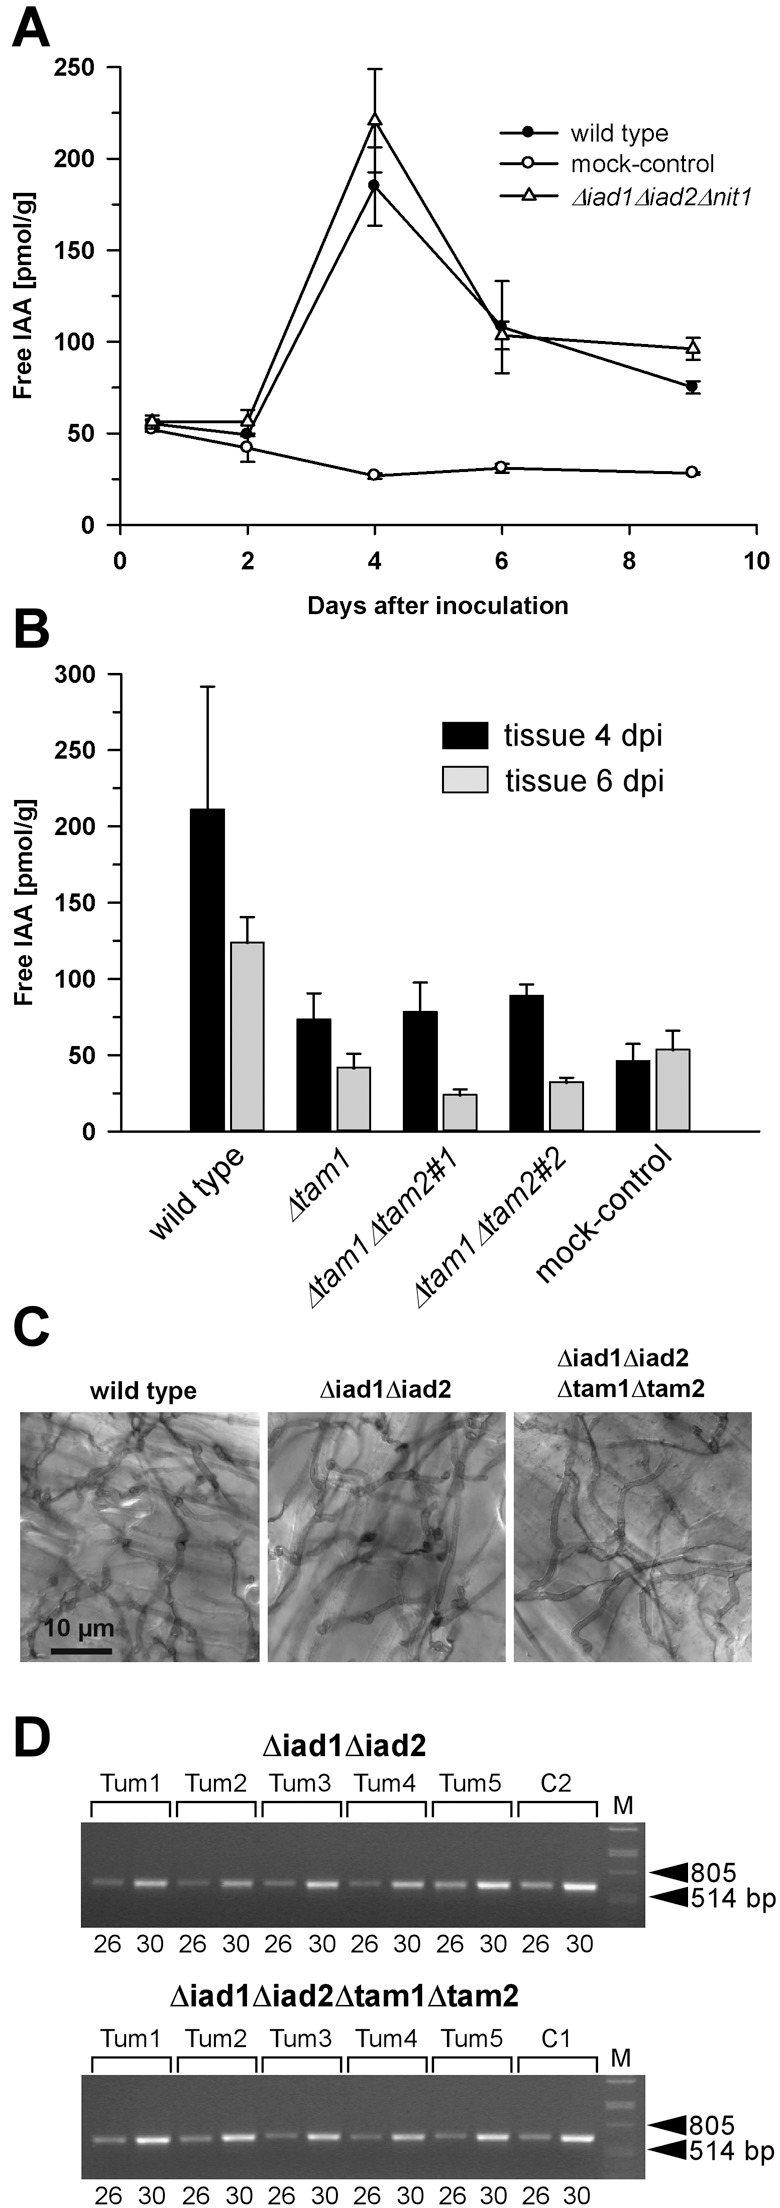
 ). (B) Plants were inoculated with either combinations of FB1/FB2 strains (wild‐type), FB1Δiad1Δiad2Δtam1/FB2Δiad1Δiad2Δtam1 strains (Δtam1), two independent combinations of FB1Δiad1Δiad2Δtam1Δtam2/FB2Δiad1Δiad2Δtam1Δtam2 strains (Δtam1Δtam2), or injected with water (mock‐control). (A,B) Concentrations of IAA are calculated in pmol/g fresh weight. Average values and standard deviations of three data points are given. Leaf material was collected at the time points indicated. For the 12‐h and 48‐h time points, material was collected 0.5–3 cm above ground and 0.5–3 cm below the injection site, respectively. For the 4‐, 6‐ and 9‐day time points, chlorotic or early leaf tumour (4 days) and leaf tumour (6 and 9 days) tissue was collected between the ligule and > 1 cm below the injection site. All parts were exclusively from the third and fourth leaves. Non‐infected control material was isolated correspondingly. For each time point, ten or more tissue samples were collected. (C) Maize plants were inoculated with either mixtures of FB1/FB2 (wild‐type), FB1Δiad1Δiad2/FB2Δiad1Δiad2 (Δiad1Δiad2) or FB1Δiad1Δiad2Δtam1Δtam2/FB2Δiad1Δiad2Δtam1Δtam2 (Δiad1Δiad2Δtam1Δtam2) strains. Two days after inoculation samples from infected leaf blade tissue were stained with Chlorazol Black E. Note the ramification of hyphae throughout the epidermal layer. The bar (10 µm) refers to all panels. (D) Detection of FB1Δiad1Δiad2/FB2Δiad1Δiad2 (Δiad1Δiad2) and FB1Δiad1Δiad2Δtam1Δtam2/FB2Δiad1Δiad2Δtam1Δtam2 (Δiad1Δiad2Δtam1Δtam2) strain combinations in maize tumours. Chromosomal DNA (100 ng) isolated from each of five individual tumours (Tum1–5) 6 days after inoculation with either of these combinations was used as template for PCR to amplify a fungal‐specific DNA fragment (see Experimental procedures). C1, C2: DNA (100 ng) isolated from the respective strain combinations prior to plant infection was used as template. Twenty‐six and 30 cycles (numbers below the lanes) were performed. The expected size of the amplified fragment is 633 bp. All lanes are from the same gel. Phage lambda (M) DNA (500 ng) digested with PstI was used as size marker.
Similar articles
-
Two potential indole-3-acetaldehyde dehydrogenases in the phytopathogenic fungus Ustilago maydis.Eur J Biochem. 1996 Dec 15;242(3):648-56. doi: 10.1111/j.1432-1033.1996.0648r.x. Eur J Biochem. 1996. PMID: 9022693
-
How to make a tumour: cell type specific dissection of Ustilago maydis-induced tumour development in maize leaves.New Phytol. 2018 Mar;217(4):1681-1695. doi: 10.1111/nph.14960. Epub 2018 Jan 4. New Phytol. 2018. PMID: 29314018
-
Development of indole-3-acetic acid-producing Escherichia coli by functional expression of IpdC, AspC, and Iad1.J Microbiol Biotechnol. 2013 Dec;23(12):1726-36. doi: 10.4014/jmb.1308.08082. J Microbiol Biotechnol. 2013. PMID: 24043123
-
Ustilago maydis secondary metabolism-from genomics to biochemistry.Fungal Genet Biol. 2008 Aug;45 Suppl 1:S88-93. doi: 10.1016/j.fgb.2008.05.007. Epub 2008 May 21. Fungal Genet Biol. 2008. PMID: 18585066 Review.
-
The excessive production of indole-3-acetic acid and its significance in studies of the biosynthesis of this regulator of plant growth and development.Plant Cell Physiol. 1996 Dec;37(8):1043-8. doi: 10.1093/oxfordjournals.pcp.a029051. Plant Cell Physiol. 1996. PMID: 9032962 Review.
Cited by
-
Physiological Mechanisms Underlying Tassel Symptom Formation in Maize Infected with Sporisorium reilianum.Plants (Basel). 2024 Jan 15;13(2):238. doi: 10.3390/plants13020238. Plants (Basel). 2024. PMID: 38256790 Free PMC article.
-
Opsin 1 and Opsin 2 of the Corn Smut Fungus Ustilago maydis Are Green Light-Driven Proton Pumps.Front Microbiol. 2019 Apr 10;10:735. doi: 10.3389/fmicb.2019.00735. eCollection 2019. Front Microbiol. 2019. PMID: 31024506 Free PMC article.
-
CgOpt1, a putative oligopeptide transporter from Colletotrichum gloeosporioides that is involved in responses to auxin and pathogenicity.BMC Microbiol. 2009 Aug 21;9:173. doi: 10.1186/1471-2180-9-173. BMC Microbiol. 2009. PMID: 19698103 Free PMC article.
-
The Application of Phytohormones as Biostimulants in Corn Smut Infected Hungarian Sweet and Fodder Corn Hybrids.Plants (Basel). 2021 Sep 1;10(9):1822. doi: 10.3390/plants10091822. Plants (Basel). 2021. PMID: 34579355 Free PMC article.
-
Plant hormones: a fungal point of view.Mol Plant Pathol. 2016 Oct;17(8):1289-97. doi: 10.1111/mpp.12393. Epub 2016 Jul 1. Mol Plant Pathol. 2016. PMID: 26950404 Free PMC article. Review.
References
-
- Banuett, F. and Herskowitz, I. (1996) Discrete developmental stages during teliospore formation in the corn smut fungus, Ustilago maydis . Development, 122, 2965–2976. - PubMed
Publication types
MeSH terms
Substances
LinkOut - more resources
Full Text Sources
