. 2008 Jan;9(1):11-24.
doi: 10.1111/j.1364-3703.2007.00437.x.

Abscisic acid deficiency leads to rapid activation of tomato defence responses upon infection with Erwinia chrysanthemi

Affiliations

Abscisic acid deficiency leads to rapid activation of tomato defence responses upon infection with Erwinia chrysanthemi

Bob Asselbergh et al. Mol Plant Pathol. 2008 Jan.

Abstract

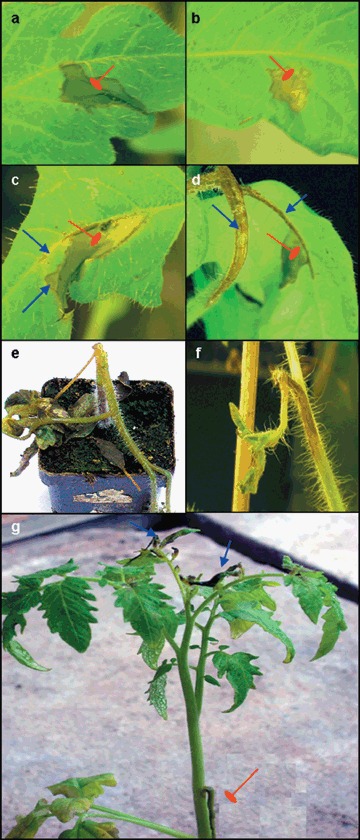
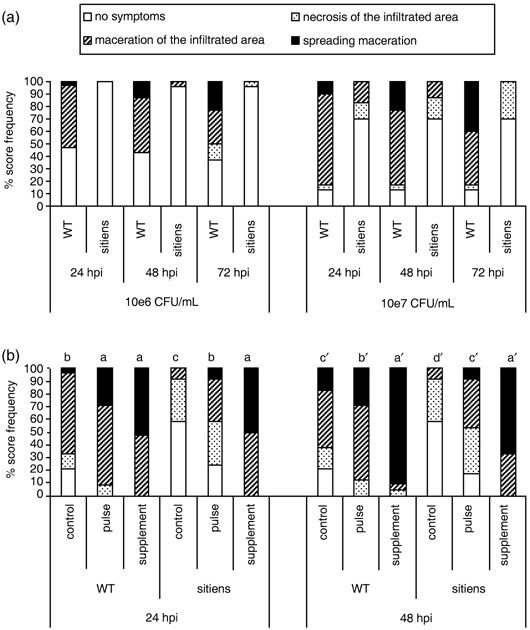
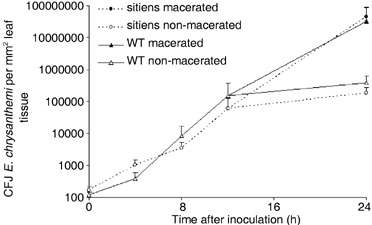
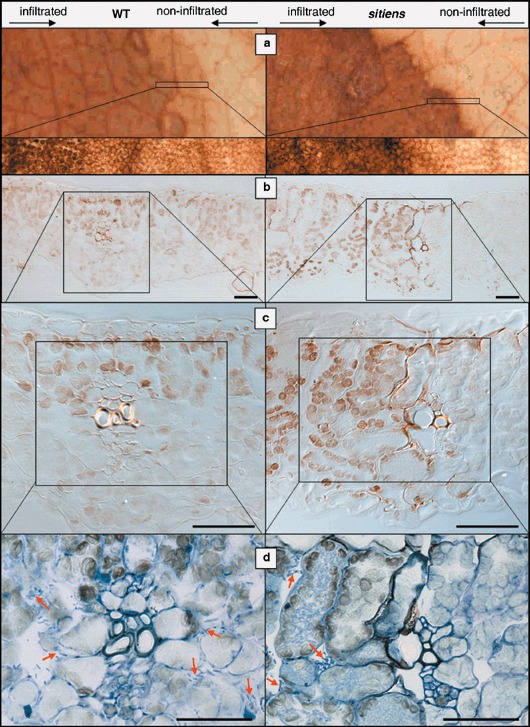
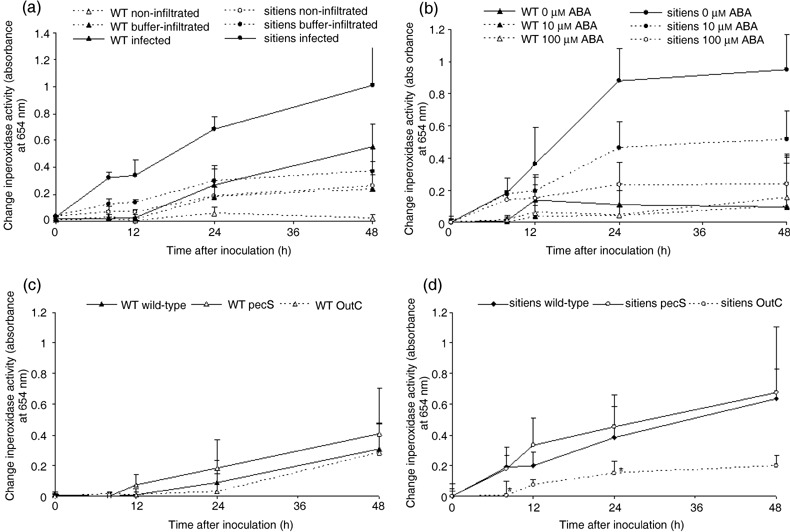
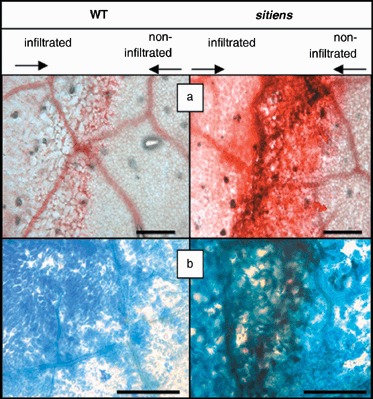
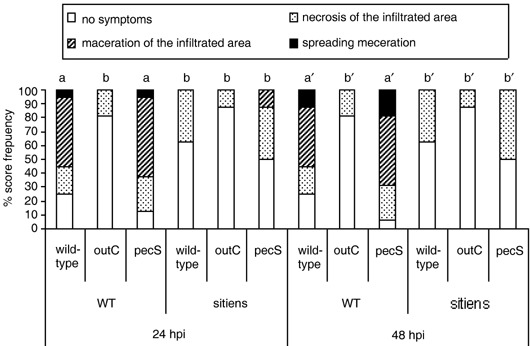
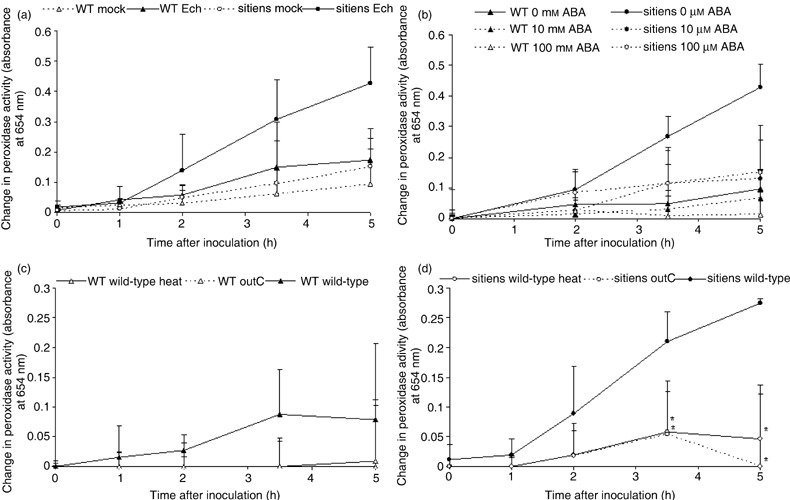
In addition to the important role of abscisic acid (ABA) in abiotic stress signalling, basal and high ABA levels appear to have a negative effect on disease resistance. Using the ABA-deficient sitiens tomato (Solanum lycopersicum) mutant and different application methods of exogenous ABA, we demonstrated the influence of this plant hormone on disease progression of Erwinia chrysanthemi. This necrotrophic plant pathogenic bacterium is responsible for soft rot disease on many plant species, causing maceration symptoms mainly due to the production and secretion of pectinolytic enzymes. On wild-type (WT) tomato cv. Moneymaker E. chrysanthemi leaf inoculation resulted in maceration both within and beyond the infiltrated zone of the leaf, but sitiens showed a very low occurrence of tissue maceration, which never extended the infiltrated zone. A single ABA treatment prior to infection eliminated the effect of pathogen restriction in sitiens, while repeated ABA spraying during plant development rendered both WT and sitiens very susceptible. Quantification of E. chrysanthemi populations inside the leaf did not reveal differences in bacterial growth between sitiens and WT. Sitiens was not more resistant to pectinolytic cell-wall degradation, but upon infection it showed a faster and stronger activation of defence responses than WT, such as hydrogen peroxide accumulation, peroxidase activation and cell-wall fortifications. Moreover, the rapid activation of sitiens peroxidases was also observed after application of bacteria-free culture filtrate containing E. chrysanthemi cell-wall-degrading enzymes and was absent during infection with an out E. chrysanthemi mutant impaired in secretion of these extracellular enzymes.


Figures

Figure 1
Figure 1
Disease symptoms on tomato cv. Moneymaker caused by syringe infiltration of 107 CFU E. chrysanthemi/mL. (a) Maceration contained in the infiltrated zone (24 hpi); (b) necrosis of the infiltrated zone (24 hpi); (c) maceration spreading beyond the infiltrated zone (sharp arrows) (48 hpi); (d) maceration spreading to petiolule and petiole of inoculated leaf (sharp arrows) (72 hpi); (e) complete collapse of plant due to stem maceration (7 dpi); (f) death of shoot apex due to systemic infection (7 dpi); (g) spread of local maceration to base of petiole of inoculated leaf (blunt arrow) and maceration of systemic leaves (sharp arrows) (7 dpi). Blunt arrows in (a), (b), (c) and (d) indicate the infiltrated zone.
Figure 2
Figure 2
Effect of abscisic acid (ABA) on E. chrysanthemi disease symptoms on tomato. (a) Disease progression at 24, 48 and 72 hpi on sitiens and WT tomato, grown under conditions of high temperature (28 °C) and high relative humidity (100%), and infiltrated with 106 or 107 CFU E. chrysanthemi/mL. At all time points and for both inoculum concentrations, disease development was significantly lower in sitiens than in the WT parent at P = 0.05. (b) Effect of different exogenous ABA treatments on sitiens and WT susceptibility to E. chrysanthemi. Plants were sprayed with 100 µm ABA at 3‐ to 4‐day intervals for 2 weeks (physiological supplementation—‘supplement’ treatment) or 4 h before inoculation (‘pulse’ treatment) and infiltrated with 107 CFU/mL. Bars with different letters indicate a significant difference between the treatments at P = 0.05. Disease development was evaluated and data analysed by the Kruskal–Wallis/Mann–Whitney non‐parametric test. At least eight plants per genotype–treatment combination were used and on each plant, disease was evaluated on three infiltrated leaflets of the same leaf. For (a) and for (b), similar results were obtained in at least three independent experiments. Data of one representative experiment are presented.
Figure 3
Figure 3
Survival and multiplication of E. chrysanthemi in sitiens and WT tomato leaf tissue. Leaf discs were taken from infiltrated tissue at the indicated time points, crushed in 50 mm KCl, plated out on LB medium and incubated at 28 °C for 24 h. Colonies of Erwinia chrysanthemi gfp9 strain were identified under UV light by their green fluorescence and counted. Bacterial counts at each time point were compared statistically by the t‐test and no significant differences were detected between sitiens and WT before 24 hpi in three independent experiments. Each data point represents the means + the standard error from one experiment using five or six plants per treatment. At 24 hpi, five macerated and five non‐macerated samples from WT and from sitiens were selected, without representing the frequency of maceration in both genotypes.
Figure 4
Figure 4
H2O2 accumulation at the border of E. chrysanthemi lesions in WT and sitiens leaf tissue at 24 hpi. DAB accumulation was evaluated on intact leaf discs (a), and on cross‐sections without (b and c) and with (d) toluidine blue staining. Lesions in WT are characterized by a gradual decrease in chloroplastic H2O2 accumulation towards the outside of the lesion, while sitiens lesions have a clear border between mesophyll cells that contain or lack chloroplastic H2O2. This border in sitiens is located at the site of minor veins and in addition, cells in the vicinity of vascular tissues of the border accumulate extracellular H2O2. Toluidine blue staining (d) reveals bacteria on both sides of the minor vein in WT leaves, while in sitiens no bacteria are present beyond the zone of extracellular H2O2 accumulation. Some bacterial microcolonies are marked with arrows. Scale bar = 50 µm.
Figure 5
Figure 5
Extracellular peroxidase activity in WT and sitiens inoculated with E. chrysanthemi. (a) Leaf discs were sampled from leaves infiltrated with 106 CFU/mL E. chrysanthemi (‘infected’) or 50 mm KCl (‘buffer‐infiltrated’). Leaf discs without infiltration zone were also sampled (‘non‐infiltrated’). (b) Leaf discs were sampled from WT and sitiens infiltrated with 106 CFU/mL E. chrysanthemi 4 h after a single spray with 0, 10 or 100 µm ABA. All spray solutions contained 0.05% ethanol. (c,d) Leaf discs were sampled from WT (c) and sitiens (d) leaves infiltrated with 106 CFU/mL of E. chrysanthemi wild‐type strain, the pathogenicity factor overproducer pecS strain and the type II secretion‐deficient outC strain. In (b), (c) and (d), the presented change in peroxidase activity is the absolute activity value after subtraction of the activity level of buffer‐infiltrated samples for each time point. During sampling, discs were fixed in ethanol and peroxidase activity was measured at 654 nm after addition of TMB and 0.03% H2O2. The mean + standard error of the absorbance of the incubation solution from four discs of different plants are presented. In (c) and (d), significant differences at P = 0.05 between wild‐type and the two mutant treatments were determined by using one‐way anova and Duncan post‐hoc tests for each time point and are indicated with ‘*’. All experiments were repeated with similar results.
Figure 6
Figure 6
Cell‐wall fortification in WT and sitiens tomato 48 h after inoculation with E. chrysanthemi. Cell‐wall fortifications were visualized with safranin‐o (red–pink) to detect incorporation of phenolics (a) and Coomassie Blue staining after SDS denaturation to detect protein cross‐linking (dark blue) (b). In both genotypes, a weak accumulation of the stains is present inside dead cells of the infiltrated zone (left), while the non‐infiltrated zone (right) remains unstained. Cell‐wall fortifications at the border of the infiltrated zone in sitiens are strongly stained. Representative borders of sitiens and WT were selected after observation of at least ten inoculation sites. The experiment was repeated with similar results. Scale bar = 200 µm.
Figure 7
Figure 7
Disease progression of E. chrysanthemi strains with different pectinase production on sitiens and WT tomato at 24 and 48 hpi. The 2nd youngest leaf of plants at the three‐ to four‐leaf stage were infiltrated with 106 CFU/mL of E. chrysanthemi wild‐type strain, the pathogenicity factor overproducer pecS strain and the type II secretion‐deficient outC strain. Disease development was evaluated at 24 and 48 hpi and data analysed by the Kruskal–Wallis/Mann–Whitney non‐parametric test. Bars with different letters indicate a significant difference between the treatments at P = 0.05. Similar results were obtained from two independent experiments using at least eight plants per treatment. Data from one experiment are presented.
Figure 8
Figure 8
Extracellular peroxidase activity in WT and sitiens infiltrated with E. chrysanthemi pectinase‐containing culture filtrate. (a) Leaf discs were sampled from leaves infiltrated with the culture filtrate (CF) of E. chrysanthemi grown on a medium containing PGA to induce pectinase production (‘Ech’) or with pure medium (‘mock’). (b) Leaf discs were sampled from WT and sitiens infiltrated with CF 4 h after a single spray with 0, 10 or 100 µm ABA. All spray solutions contained 0.05% ethanol. (c,d) Leaf discs were sampled from WT (c) and sitiens (d) leaves infiltrated with CF of E. chrysanthemi strains with functional type II secretion (‘wild‐type’) and type II secretion deficiency (‘outC’). In addition, heat‐treated (80 °C for 15 min) pectinase‐containing CF (‘wild‐type heat’) was used. In (b), (c) and (d), the presented change in peroxidase activity is the absolute activity value after subtraction of the activity level of medium‐infiltrated samples for each time point. During sampling, discs were fixed in ethanol and peroxidase activity was measured at 654 nm after addition of TMB and 0.03% H2O2. The mean + standard error of the absorbance of the incubation solution from four discs of different plants are presented. In (c) and (d), significant differences at P = 0.05 between ‘wild‐type’ and the two other treatments were determined by using one‐way anova and Duncan post‐hoc tests for each time point and are indicated with ‘*’. All experiments were repeated with similar results.

References

    1. Achuo, E.A. , Prinsen, E. and Höfte, M. (2006) Influence of drought, salt stress and abscisic acid on the resistance of tomato to Botrytis cinerea and Oidium neolycopersici . Plant Pathol. 55, 178–186.
    1. Anderson, J.P. , Badruzsaufari, E. , Schenk, P.M. , Manners, J.M. , Desmond, O.J. , Ehlert, C. , Maclean, D.J. , Ebert, P.R. and Kazan, K. (2004) Antagonistic interaction between abscisic acid and jasmonate‐ethylene signaling pathways modulates defense gene expression and disease resistance in Arabidopsis. Plant Cell, 16, 3460–3479. - PMC - PubMed
    1. Andro, T. , Chambost, J.P. , Kotoujansky, A. , Cattaneo, J. , Bertheau, Y. , Barras, F. , Van Gijsegem, F. and Coleno, A. (1984) Mutants of Erwinia chrysanthemi defective in secretion of pectinase and cellulase. J. Bacteriol. 160, 1199–1203. - PMC - PubMed
    1. Apel, K. and Hirt, H. (2004) Reactive oxygen species: Metabolism, oxidative stress, and signal transduction. Ann. Rev. Plant Biol. 55, 373–399. - PubMed
    1. Audenaert, K. , De Meyer, G.B. and Höfte, M. (2002) Abscisic acid determines basal susceptibility of tomato to Botrytis cinerea and suppresses salicylic acid‐dependent signaling mechanisms. Plant Physiol. 128, 491–501. - PMC - PubMed

Publication types

MeSH terms

LinkOut - more resources