

MCP-1-deficient mice show reduced neuroinflammatory responses and increased peripheral inflammatory responses to peripheral endotoxin insult
- PMID: 18706086
- PMCID: PMC2527558
- DOI: 10.1186/1742-2094-5-35
MCP-1-deficient mice show reduced neuroinflammatory responses and increased peripheral inflammatory responses to peripheral endotoxin insult
Abstract
Background: An endotoxin insult mimics a severe peripheral infection and recent evidence suggests that a single exposure can cause long-term cognitive deficits. A peripheral injection of LPS results in production of pro-inflammatory cytokines, such as IL-1beta and TNF-alpha, in the brain and periphery and these cytokines mediate many effects of the acute phase response including activation of the HPA axis. The chemokine MCP-1 is highly expressed during endotoxemia and although much is known about the importance of MCP-1 in peripheral inflammatory responses to LPS, information about MCP-1 and CNS responses to peripheral LPS is lacking.
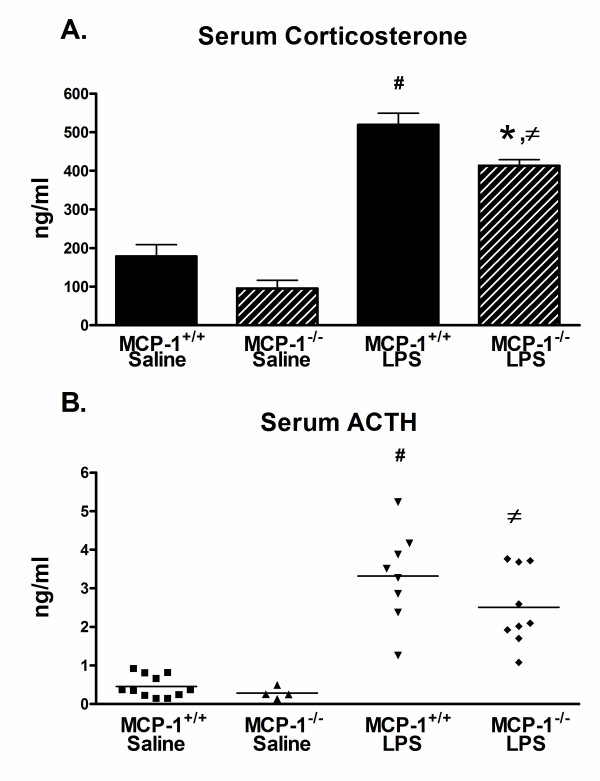
Methods: C57Bl/6 mice were administered LPS by intraperitoneal (i.p.) injection, serum and brains were collected at several time points, and the time course of MCP-1 protein up-regulation was measured. To examine the role of MCP-1 in activation of the brain during acute systemic inflammation, we injected MCP-1 knockout (MCP-1-/-) or control C57Bl/6 (MCP-1+/+) mice with LPS i.p. and measured the levels of selected cytokines and chemokines in serum and brain extracts 6 hours later. Activated microglia were examined by CD45 immunohistochemistry, and serum corticosterone and ACTH levels were measured by enzyme immunoassay.
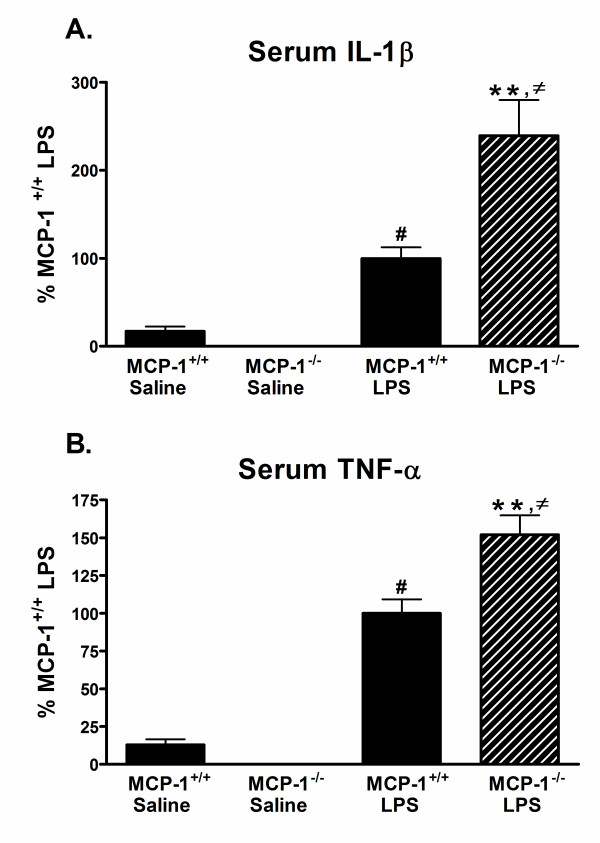
Results: We report that LPS injection induces a robust increase in MCP-1 protein levels in serum and brain, with peak brain levels reached at 6 hrs after LPS administration. MCP-1-/- mice injected with LPS showed higher levels of serum IL-1beta and TNF-alpha compared to LPS-treated MCP-1+/+ mice. In contrast, these MCP-1-/- mice showed significantly lower inductions of brain pro-inflammatory cytokines and chemokines, fewer activated microglia, and a reduction in serum corticosterone levels.
Conclusion: MCP-1-/- mice have decreased brain inflammation after a peripheral LPS insult, despite an exaggerated peripheral response. These data demonstrate an important role for MCP-1 in regulation of brain inflammation after peripheral endotoxemia.
Figures


Similar articles
-
Role of several mediators of inflammation on the mouse hypothalamo-pituitary-adrenal axis response during acute endotoxemia.Neuroimmunomodulation. 1999 Sep-Oct;6(5):336-43. doi: 10.1159/000026393. Neuroimmunomodulation. 1999. PMID: 10474052
-
A systematic analysis of the peripheral and CNS effects of systemic LPS, IL-1β, [corrected] TNF-α and IL-6 challenges in C57BL/6 mice.PLoS One. 2013 Jul 1;8(7):e69123. doi: 10.1371/journal.pone.0069123. Print 2013. PLoS One. 2013. PMID: 23840908 Free PMC article.
-
Increased systemic and brain cytokine production and neuroinflammation by endotoxin following ethanol treatment.J Neuroinflammation. 2008 Mar 18;5:10. doi: 10.1186/1742-2094-5-10. J Neuroinflammation. 2008. PMID: 18348728 Free PMC article.
-
Molecular and cellular neuroinflammatory status of mouse brain after systemic lipopolysaccharide challenge: importance of CCR2/CCL2 signaling.J Neuroinflammation. 2014 Jul 28;11:132. doi: 10.1186/1742-2094-11-132. J Neuroinflammation. 2014. PMID: 25065370 Free PMC article.
-
The Role of Pro-Inflammatory and Regulatory Signaling by IL-33 in the Brain and Liver: A Focused Systematic Review of Mouse and Human Data and Risk of Bias Assessment of the Literature.Int J Mol Sci. 2020 May 30;21(11):3933. doi: 10.3390/ijms21113933. Int J Mol Sci. 2020. PMID: 32486265 Free PMC article.
Cited by
-
A systemic immune challenge to model hospital-acquired infections independently regulates immune responses after pediatric traumatic brain injury.J Neuroinflammation. 2021 Mar 17;18(1):72. doi: 10.1186/s12974-021-02114-1. J Neuroinflammation. 2021. PMID: 33731173 Free PMC article.
-
Quercetin attenuates cisplatin-induced fatigue through mechanisms associated with the regulation of the HPA axis and MCP-1 signaling.Front Nutr. 2025 Jan 30;12:1530132. doi: 10.3389/fnut.2025.1530132. eCollection 2025. Front Nutr. 2025. PMID: 39949542 Free PMC article.
-
Small interfering RNA-mediated suppression of Ccl2 in Müller cells attenuates microglial recruitment and photoreceptor death following retinal degeneration.J Neuroinflammation. 2012 Sep 19;9:221. doi: 10.1186/1742-2094-9-221. J Neuroinflammation. 2012. PMID: 22992301 Free PMC article.
-
CCL2 modulates cytokine production in cultured mouse astrocytes.J Neuroinflammation. 2010 Oct 14;7:67. doi: 10.1186/1742-2094-7-67. J Neuroinflammation. 2010. PMID: 20942978 Free PMC article.
-
Neuroimmunology of Behavioral Comorbidities Associated With Cancer and Cancer Treatments.Front Immunol. 2018 Jun 7;9:1195. doi: 10.3389/fimmu.2018.01195. eCollection 2018. Front Immunol. 2018. PMID: 29930550 Free PMC article. Review.
References
-
- Beishuizen A, Thijs LG. Endotoxin and the hypothalamo-pituitary-adrenal (HPA) axis. Journal of endotoxin research. 2003;9:3–24. - PubMed
Publication types
MeSH terms
Substances
Grants and funding
LinkOut - more resources
Full Text Sources
Other Literature Sources
Research Materials
Miscellaneous
