. 2008 Sep 9;47(36):9565-73.
doi: 10.1021/bi8006862. Epub 2008 Aug 16.

The low-pH unfolded state of the C-terminal domain of the ribosomal protein L9 contains significant secondary structure in the absence of denaturant but is no more compact than the low-pH urea unfolded state

Affiliations

The low-pH unfolded state of the C-terminal domain of the ribosomal protein L9 contains significant secondary structure in the absence of denaturant but is no more compact than the low-pH urea unfolded state

Bing Shan et al. Biochemistry. .

Abstract

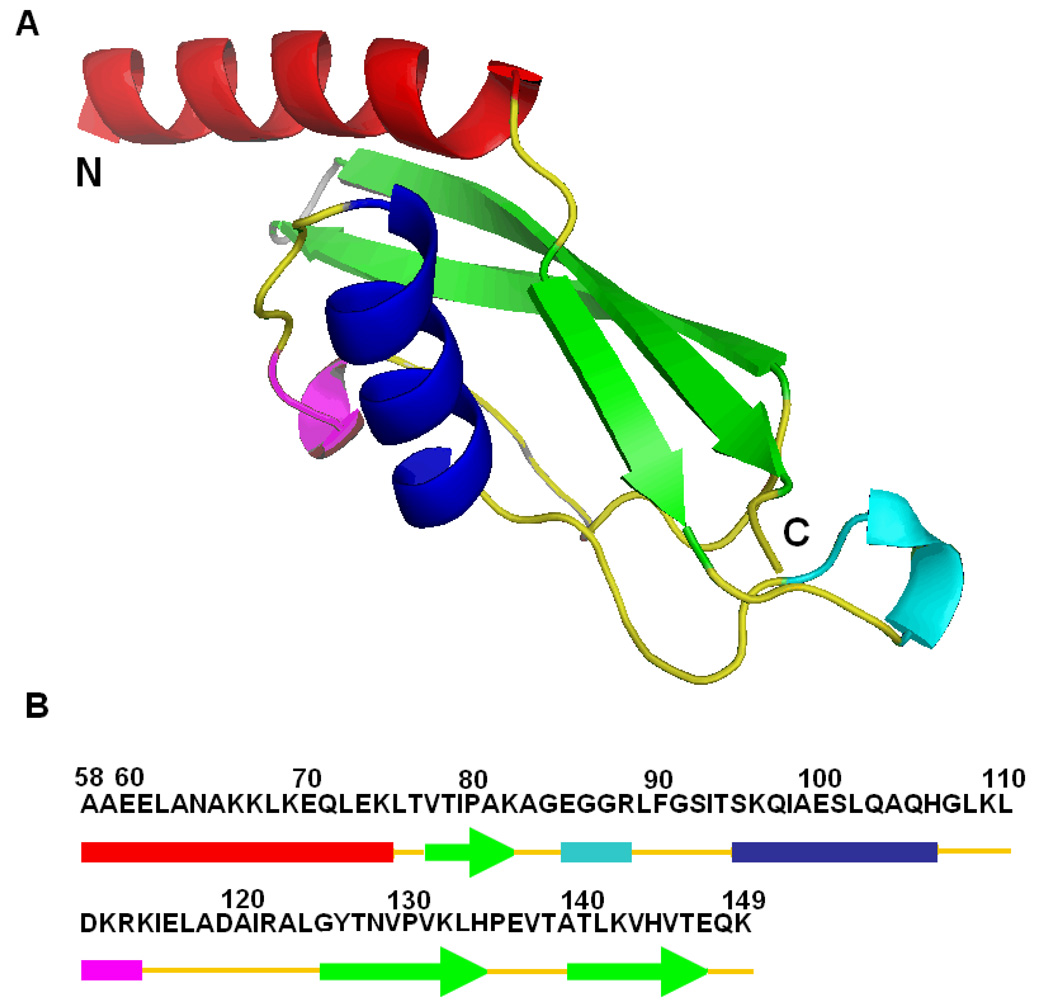
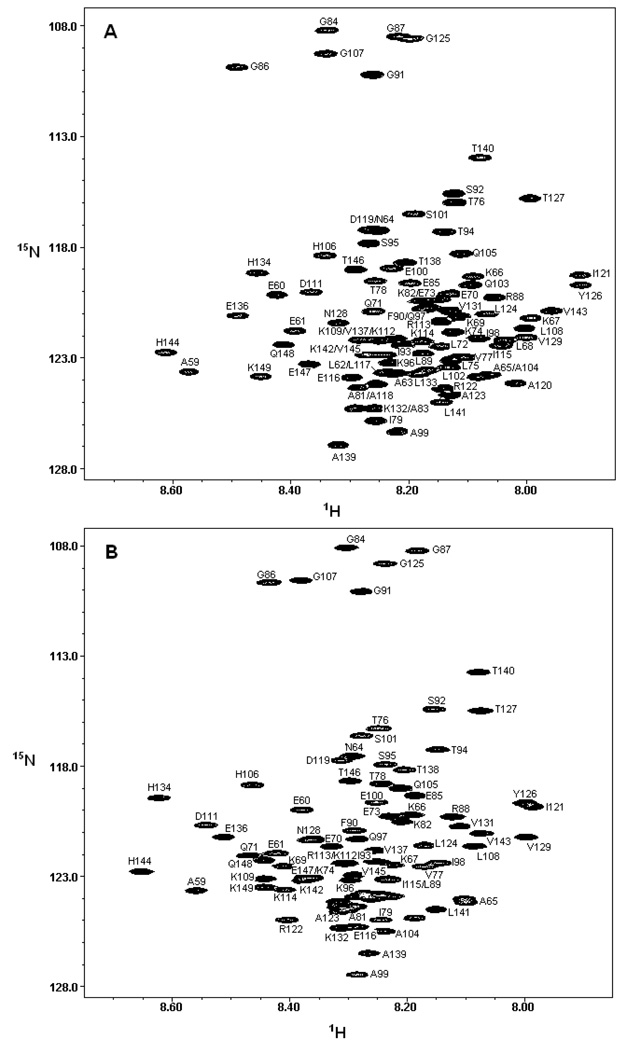
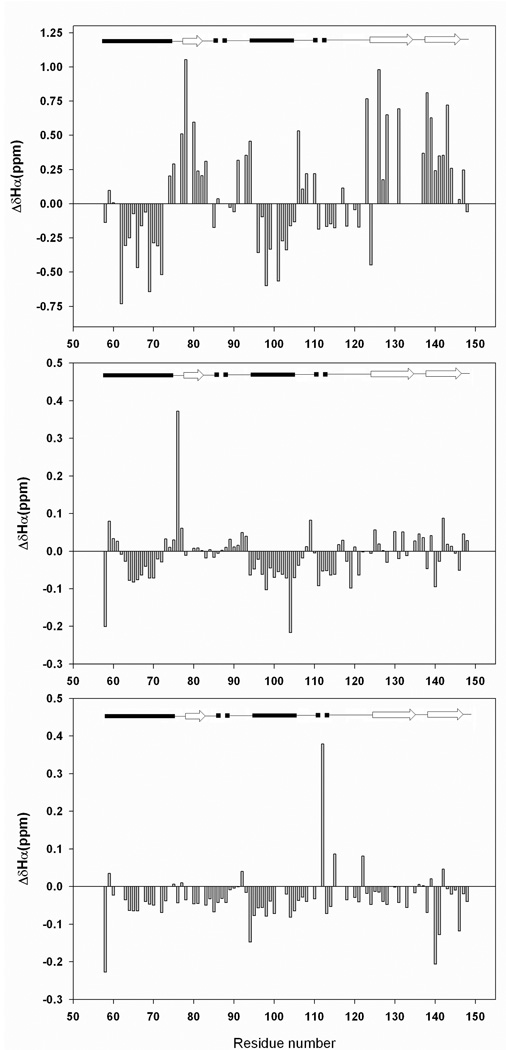
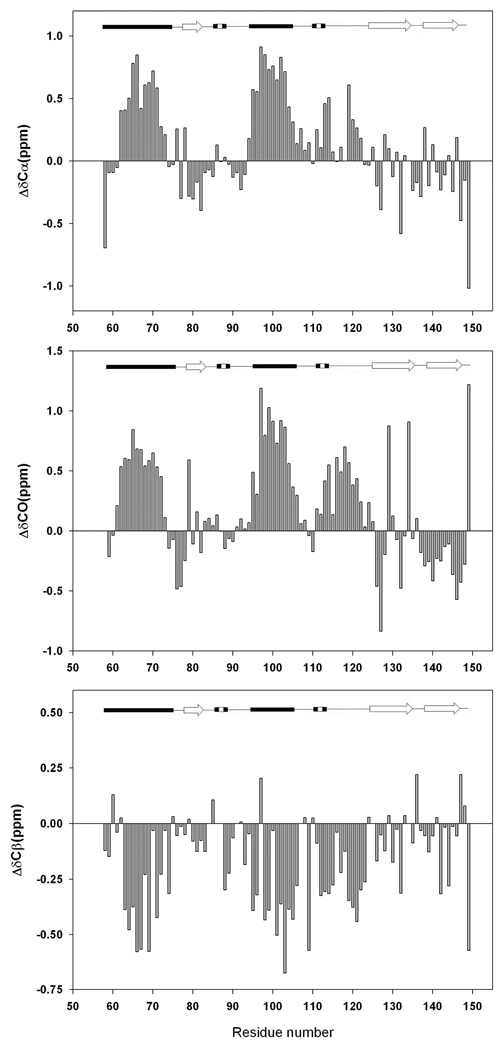
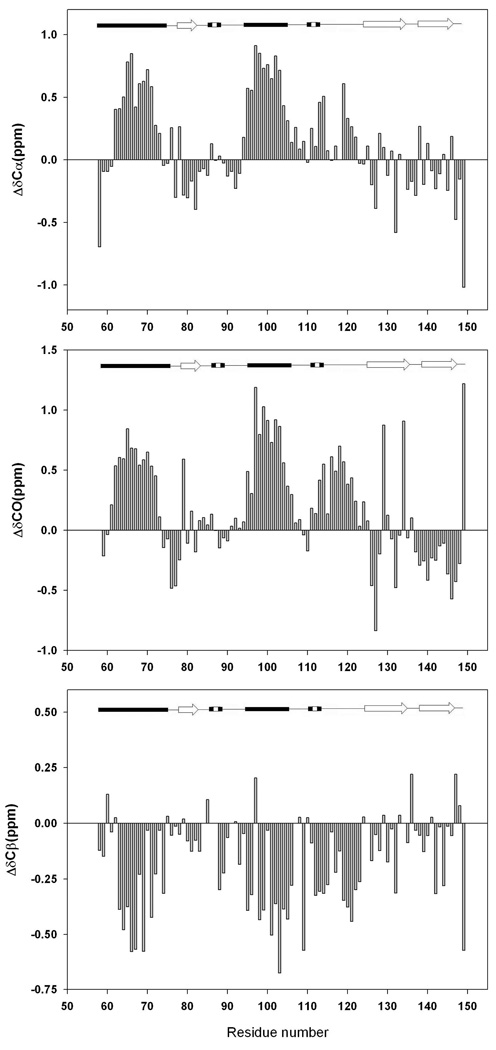
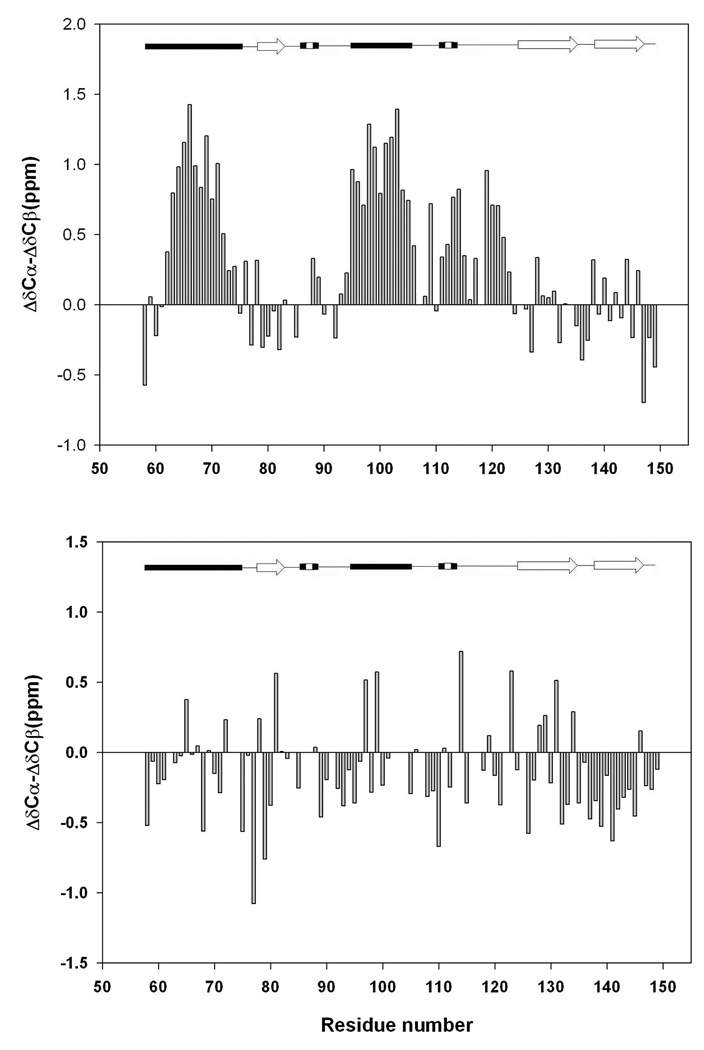
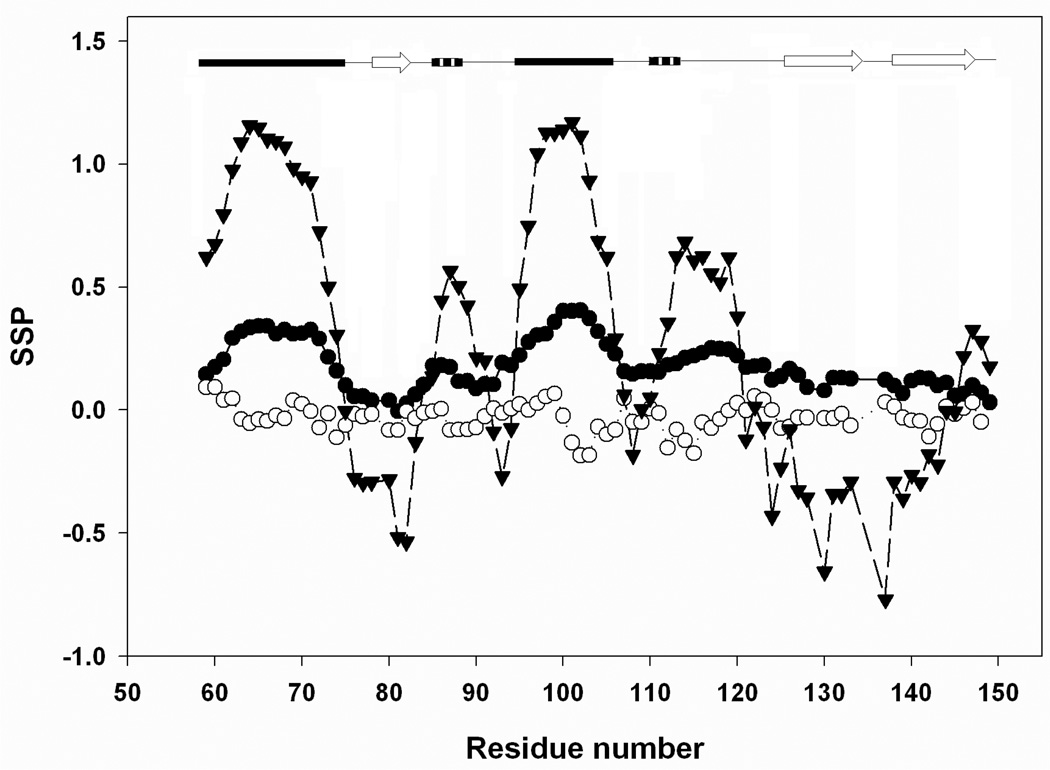
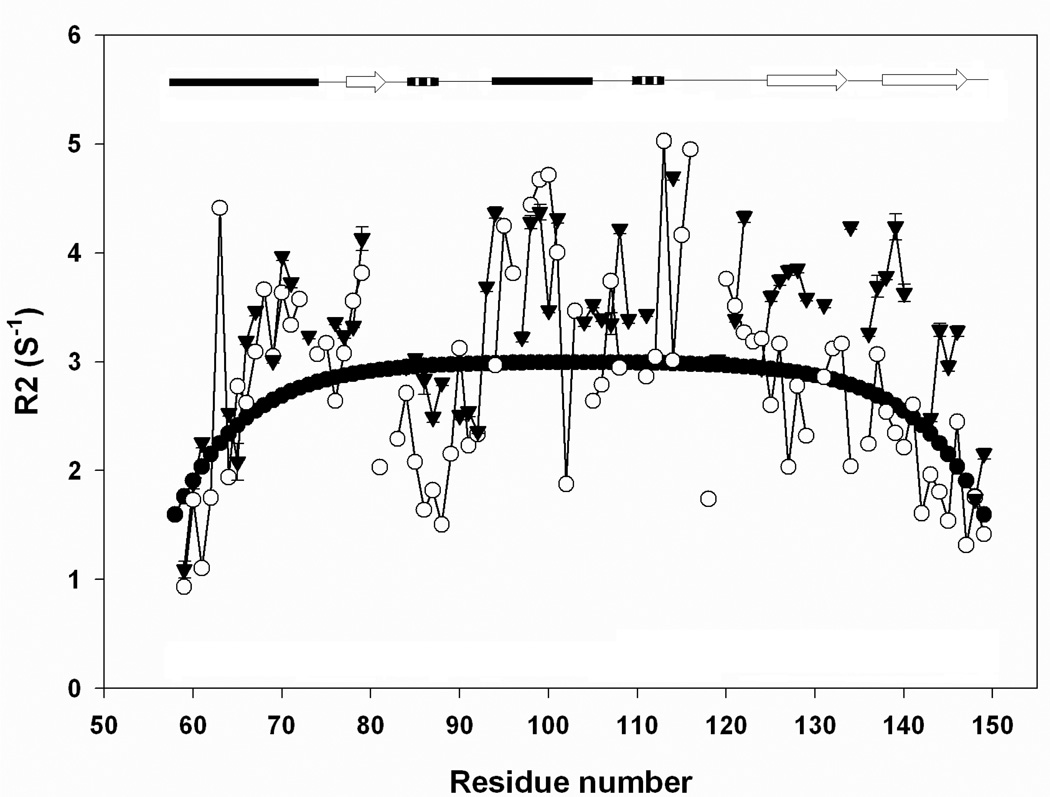
There is considerable interest in the properties of the unfolded states of proteins, particularly unfolded states which can be populated in the absence of high concentrations of denaturants. Interest in the unfolded state ensemble reflects the fact that it is the starting point for protein folding as well as the reference state for protein stability studies and can be the starting state for pathological aggregation. The unfolded state of the C-terminal domain (residues 58-149) of the ribosomal protein L9 (CTL9) can be populated in the absence of denaturant at low pH. CTL9 is a 92-residue globular alpha, beta protein. The low-pH unfolded state contains more secondary structure than the low-pH urea unfolded state, but it is not a molten globule. Backbone ( (1)H, (13)C, and (15)N) NMR assignments as well as side chain (13)C beta and (1)H beta assignments and (15)N R 2 values were obtained for the pH 2.0 unfolded form of CTL9 and for the urea unfolded state at pH 2.5. Analysis of the deviations of the chemical shifts from random coil values indicates that residues that comprise the two helices in the native state show a clear preference for adopting helical phi and psi angles in the pH 2.0 unfolded state. There is a less pronounced but nevertheless clear tendency for residues 107-124 to preferentially populate helical phi and psi values in the unfolded state. The urea unfolded state has no detectable tendency to populate any type of secondary structure even though it is as compact as the pH 2.0 unfolded state. Comparison of the two unfolded forms of CTL9 provides direct experimental evidence that states which differ significantly in their secondary structure can have identical hydrodynamic properties. This in turn demonstrates that global parameters such as R h or R g are very poor indicators of "random coil" behavior.


Figures

Figure 1
Figure 1
The structure of CTL9. (A) Ribbon diagram of residues 58 to 149 of L9 (pdb file code1DIV). The N and C termini are labeled. (B) The primary sequence of CTL9 is shown together with a schematic representation of the different elements of secondary structures (arrows represent β-strands, colored cylinders represent α-helices and 310 helices). The ribbon diagram was constructed using PyMOL.
Figure 2
Figure 2
(A) The 15N-1H HSQC spectrum of the pH 2.0 unfolded state of CTL9. (B) The 15N-1H HSQC spectrum of the pH 2.5, 7.6 M urea unfolded state of CTL9. Peaks are labeled in both spectra. Spectra were collected at 25 °C.
Figure-3
Figure-3
Plots of the deviations of the measured Cα 1H chemical shifts and random coil chemical shifts. Data plotted as observed-random coil. Random coil values in acidic (pH 2.3) 8M urea were used (28) together with sequence specific corrections (29). (A) Deviations for the native state (pH 3.8); (B) Deviations for the pH 2.0 unfolded state. (C) Deviations for the pH 2.5, 7.6 M urea unfolded state. A schematic representation of the elements of secondary structure of the native state of CTL9 is shown at the top of the figure (arrows represent β-strands, filled cylinders represent α-helices, dashed cylinders represent 310 helices and single lines represent loop regions).
Figure-4
Figure-4
Plots of the deviations of the measured 13C chemical shifts of the pH 2.0 unfolded state of CTL9 from random coil chemical values. Data plotted as observed-random coil. (A) 13Cα chemical shifts deviations, (B) Carbonyl 13C chemical shifts deviations, (C). 13Cβ chemical shifts deviations. Sequence dependent corrections were made (29). A schematic diagram of the elements of secondary structure of the native state of CTL9 is shown at the top of the figure.
Figure-5
Figure-5
Plots of the deviations of the measured 13C chemical shifts of the pH 2.5, 7.6 M urea unfolded state of CTL9 from random coil chemical values. Data plotted as observedrandom coil. (A) 13Cα chemical shifts deviations, (B) Carbonyl 13C chemical shifts deviations, (C) 13Cβ chemical shifts deviations. Random coil values in acidic (pH 2.3) 8M urea were used (28) and sequence dependent corrections were made (29). A schematic diagram of the elements of secondary structure of the native state of CTL9 is shown at the top of the figure.
Figure-6
Figure-6
A plot of the difference of the secondary shifts of the 13Cα and 13Cβ chemical shifts for (A) the pH 2.0 unfolded state of CTL9 and (B) the pH 2.5, 7.6 M urea unfolded state. A schematic diagram of the elements of secondary structure of the native state of CTL9 is shown at the top of the figure.
Figure-7
Figure-7
SSP analysis of the pH 2.0 (●) and the pH 2.5, 7.6 M urea (○) unfolded state of CTL9 conducted using the method of Forman-Kay and coworkers (26). The calculation for the pH 3.8 native state is included for comparison (▼). Positive values represent a propensity to populate the helical region of the φ, ψ map while negative values indicate a preference for the β-sheets region. A schematic diagram of the elements of secondary structure of the native state of CTL9 is shown at the top of the figure. 13Cα, 13Cβ and Cα 1H chemical shifts were used in the analysis.
Figure-8
Figure-8
A plot of 15N R2 rates for the pH 2.0 unfolded state (○) and the pH 2.5, 7.6 M urea unfolded state (▼). The solid line is the best fit to the phenomenological model of Schwalbe and coworkers (5).

References

    1. Baldwin RL. A new perspective on unfolded proteins. Advan. Protein Chem. 2002;62:361–367. - PubMed
    1. Dyson HJ, Wright PE. Intrinsically unstructured proteins and their functions. Nature Rev. Mol. Cell Biol. 2005;6:197–208. - PubMed
    1. Cho JH, Sato S, Raleigh DP. Thermodynamics and kinetics of nonnative interactions in protein folding: a single point mutant significantly stabilizes the N-terminal domain of L9 by modulating non-native interactions in the denatured state. J. Mol. Biol. 2004;338:827–837. - PubMed
    1. Mok YK, Elisseeva EL, Davidson AR, Forman-Kay JD. Dramatic stabilization of an SH3 domain by a single substitution: roles of the folded and unfolded states. J. Mol. Biol. 2001;307:913–928. - PubMed
    1. Klein-Seetharaman J, Oikawa M, Grimshaw SB, Wirmer J, Duchardt E, Ueda T, Imoto T, Smith LJ, Dobson CM, Schwalbe H. Long-range interactions within a nonnative protein. Science. 2002;295:1719–1722. - PubMed

Publication types