

PPARG by dietary fat interaction influences bone mass in mice and humans
- PMID: 18707223
- PMCID: PMC2683155
- DOI: 10.1359/jbmr.080419
PPARG by dietary fat interaction influences bone mass in mice and humans
Abstract
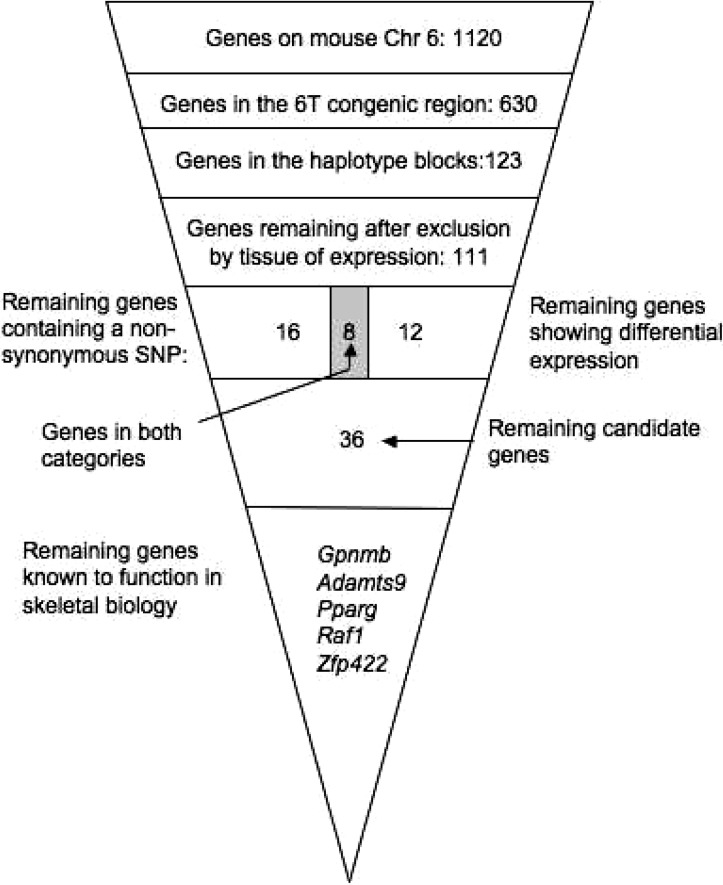
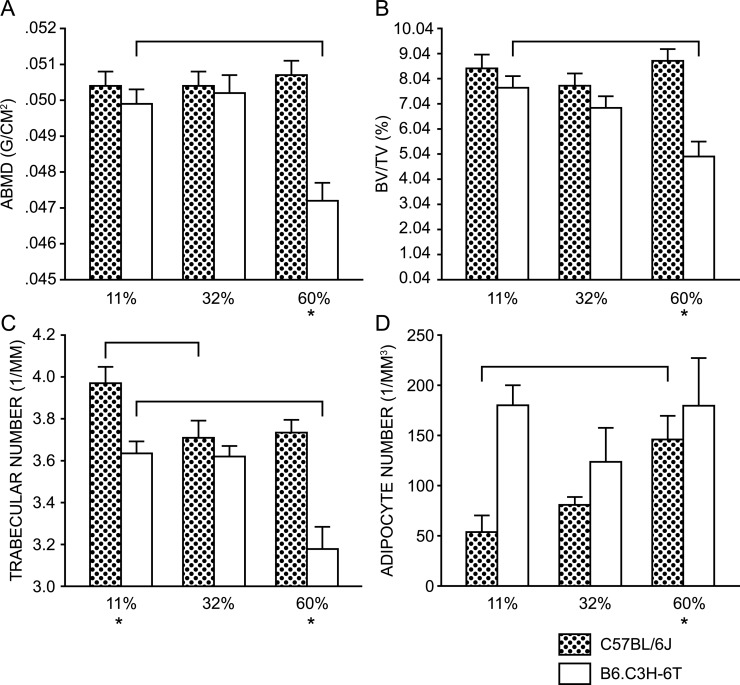
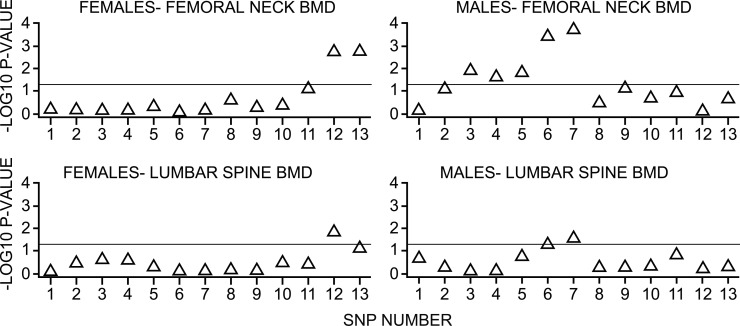
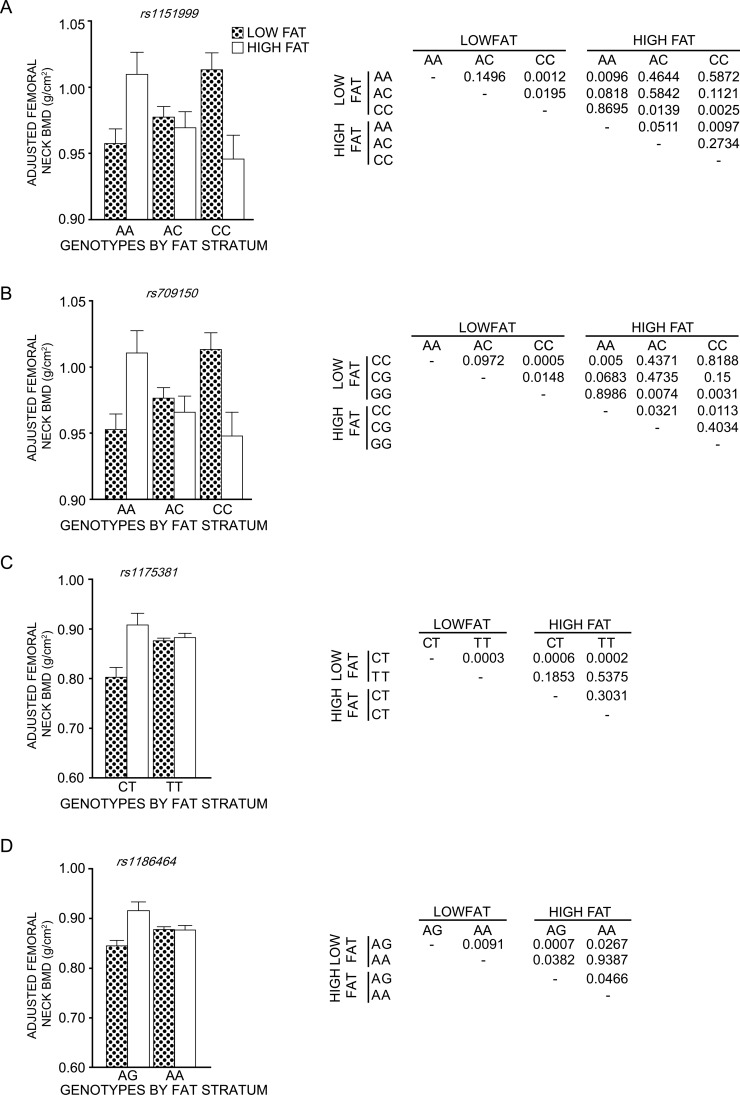
Adult BMD, an important risk factor for fracture, is the result of genetic and environmental interactions. A quantitative trait locus (QTL) for the phenotype of volumetric BMD (vBMD), named Bmd8, was found on mid-distal chromosome (Chr) 6 in mice. This region is homologous to human Chr 3p25. The B6.C3H-6T (6T) congenic mouse was previously created to study this QTL. Using block haplotyping of the 6T congenic region, expression analysis in the mouse, and examination of nonsynonymous SNPs, peroxisome proliferator activated receptor gamma (Pparg) was determined to be the most likely candidate gene for the Bmd8 QTL of the 630 genes located in the congenic region. Furthermore, in the C3H/HeJ (C3H) strain, which is the donor strain for the 6T congenic, several polymorphisms were found in the Pparg gene. On challenge with a high-fat diet, we found that the 6T mouse has a lower areal BMD (aBMD) and volume fraction of trabecular bone (BV/TV%) of the distal femur compared with B6 mice. Interactions between SNPs in the PPARG gene and dietary fat for the phenotype of BMD were examined in the Framingham Offspring Cohort. This analysis showed that there was a similar interaction of the PPARG gene and diet (fat intake) on aBMD in both men and women. These findings suggest that dietary fat has a significant influence on BMD that is dependent on the alleles present for the PPARG gene.
Figures
References
-
- Ralston S, de Crombrugghe B. Genetic regulation of bone mass and susceptibility to osteoporosis. Genes Dev. 2006;20:2492–2506. - PubMed
-
- Williams F, Spector T. Recent advances in the genetics of osteoporosis. J Musculoskelet Neuronal Interact. 2006;6:27–35. - PubMed
-
- Huang QY, Recker RR, Deng HW. Searching for osteoporosis genes in the post-genome era: Progress and challenges. Osteoporos Int. 2003;14:701–715. - PubMed
-
- Beamer WG, Shultz KL, Donahue LR, Churchill G, Sen S, Wergedal JR, Baylink DJ, Rosen CJ. Quantitative trait loci for femoral and lumbar vertebral bone mineral density in C57BL/6J and C3H/HeJ inbred strains of mice. J Bone Miner Res. 2001;16:1195–1206. - PubMed
-
- Rosen CJ, Churchill G, Donahue LR, Shultz K, Burgess JK, Powell DR, Ackert C, Beamer WG. Mapping quantitative trait loci for serum insulin-like growth factor-I levels in mice. Bone. 2000;27:521–528. - PubMed
Publication types
MeSH terms
Substances
Grants and funding
- N01-HC-25195/HC/NHLBI NIH HHS/United States
- T32 HD007065/HD/NICHD NIH HHS/United States
- HL54776/HL/NHLBI NIH HHS/United States
- F31 AG030910/AG/NIA NIH HHS/United States
- N01 HC025195/HL/NHLBI NIH HHS/United States
- DK045227/DK/NIDDK NIH HHS/United States
- R01 DK042424/DK/NIDDK NIH HHS/United States
- 53-K06-5-10/PHS HHS/United States
- R01 HL054776/HL/NHLBI NIH HHS/United States
- U01 HL066582/HL/NHLBI NIH HHS/United States
- R01 AR054604/AR/NIAMS NIH HHS/United States
- R03 DK073267/DK/NIDDK NIH HHS/United States
- AR43433/AR/NIAMS NIH HHS/United States
- R01 DK045227/DK/NIDDK NIH HHS/United States
- AR/AG41398/AG/NIA NIH HHS/United States
- DK042424/DK/NIDDK NIH HHS/United States
- U01 HL 66582/HL/NHLBI NIH HHS/United States
- DK073267/DK/NIDDK NIH HHS/United States
- R01 AR050066/AR/NIAMS NIH HHS/United States
- S10 RR017868/RR/NCRR NIH HHS/United States
- AG030910-01/AG/NIA NIH HHS/United States
- AR050066/AR/NIAMS NIH HHS/United States
- AR054604/AR/NIAMS NIH HHS/United States
LinkOut - more resources
Full Text Sources
Medical
Molecular Biology Databases
