Comparative Study
. 2008 Nov;146(5):679-87.
doi: 10.1016/j.ajo.2008.06.010. Epub 2008 Aug 15.

Thickness profiles of retinal layers by optical coherence tomography image segmentation

Affiliations
Comparative Study

Thickness profiles of retinal layers by optical coherence tomography image segmentation

Ahmet Murat Bagci et al. Am J Ophthalmol. 2008 Nov.

Abstract

Purpose: To report an image segmentation algorithm that was developed to provide quantitative thickness measurement of six retinal layers in optical coherence tomography (OCT) images.

Design: Prospective cross-sectional study.

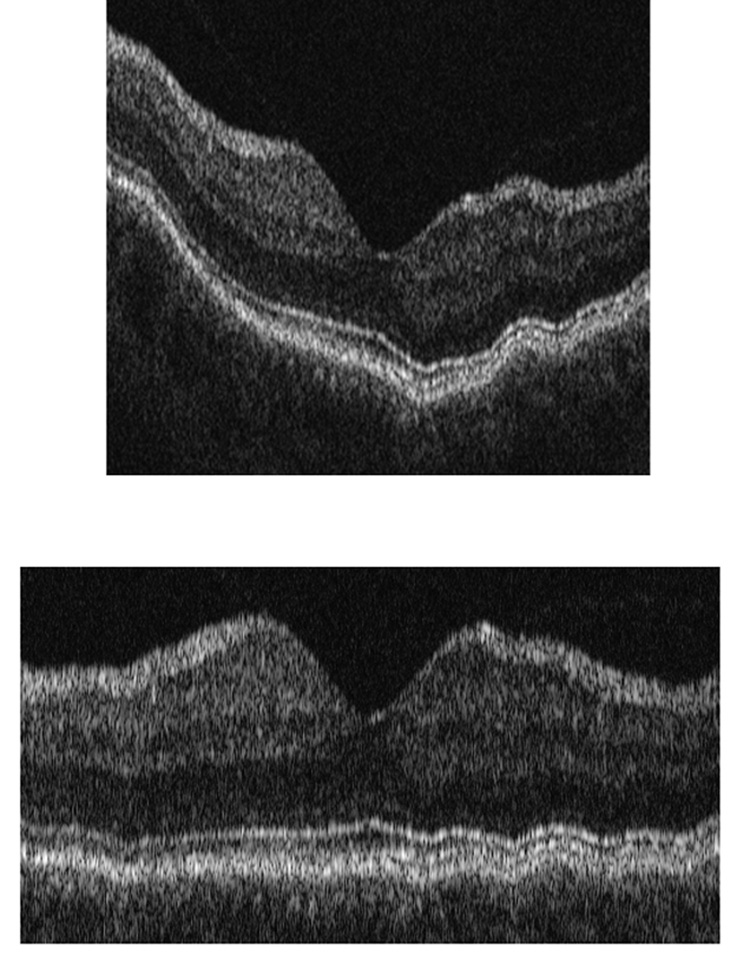
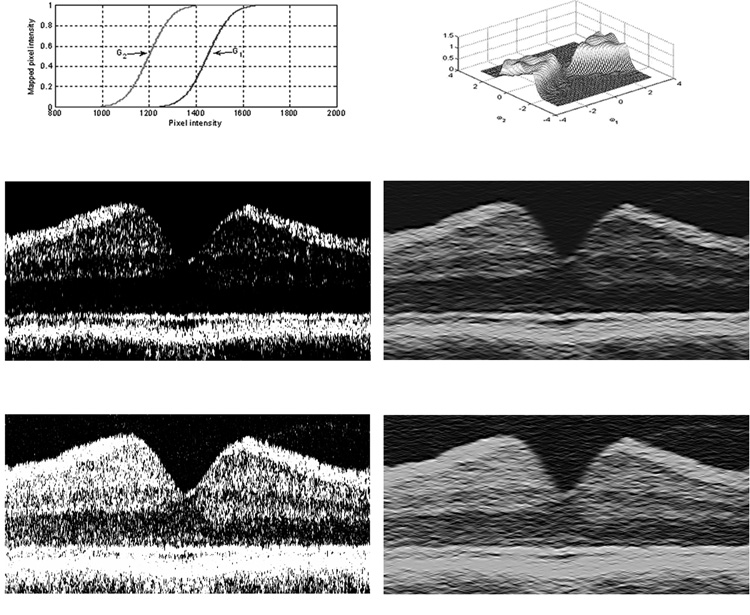
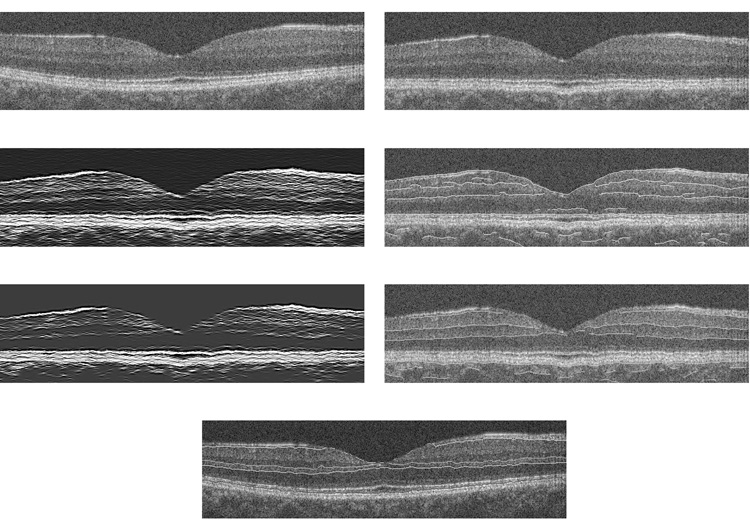
Methods: Imaging was performed with time- and spectral-domain OCT instruments in 15 and 10 normal healthy subjects, respectively. A dedicated software algorithm was developed for boundary detection based on a 2-dimensional edge detection scheme, enhancing edges along the retinal depth while suppressing speckle noise. Automated boundary detection and quantitative thickness measurements derived by the algorithm were compared with measurements obtained from boundaries manually marked by three observers. Thickness profiles for six retinal layers were generated in normal subjects.

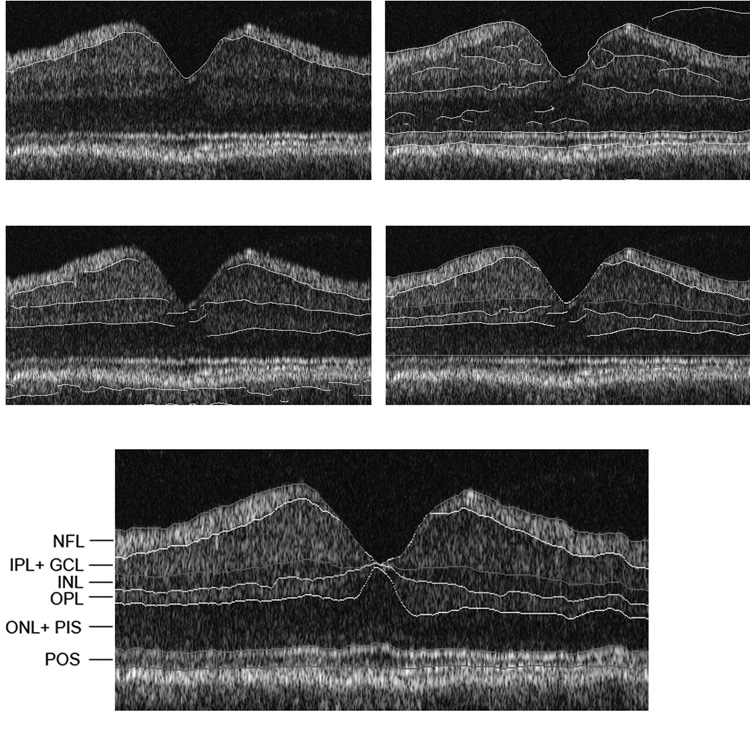
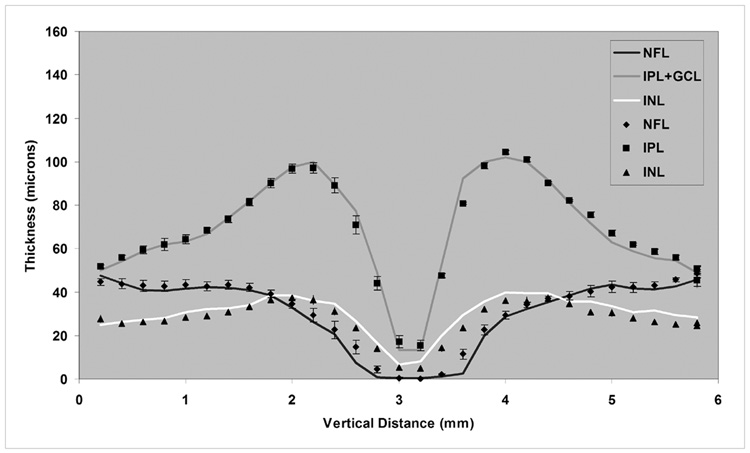
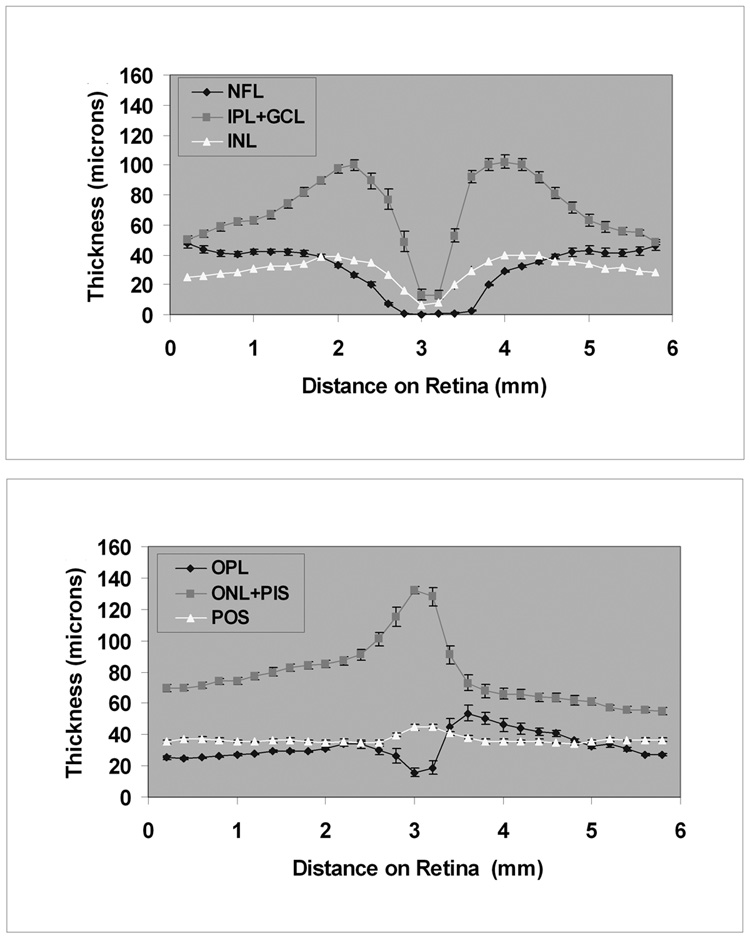
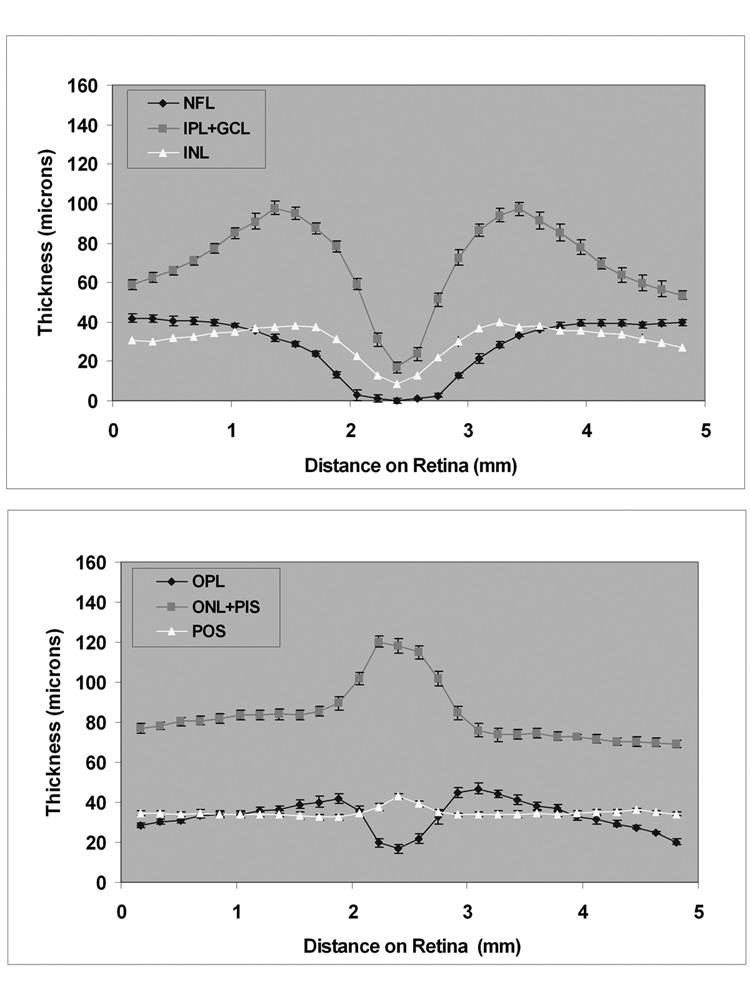
Results: The algorithm identified seven boundaries and measured thickness of six retinal layers: nerve fiber layer, inner plexiform layer and ganglion cell layer, inner nuclear layer, outer plexiform layer, outer nuclear layer and photoreceptor inner segments (ONL+PIS), and photoreceptor outer segments (POS). The root mean squared error between the manual and automatic boundary detection ranged between 4 and 9 mum. The mean absolute values of differences between automated and manual thickness measurements were between 3 and 4 mum, and comparable to interobserver differences. Inner retinal thickness profiles demonstrated minimum thickness at the fovea, corresponding to normal anatomy. The OPL and ONL+PIS thickness profiles respectively displayed a minimum and maximum thickness at the fovea. The POS thickness profile was relatively constant along the scan through the fovea.

Conclusions: The application of this image segmentation technique is promising for investigating thickness changes of retinal layers attributable to disease progression and therapeutic intervention.


Figures

Figure 1
Figure 1. Retinal Layer Segmentation Step of A-scan Alignment Applied to a Typical Time Domain OCT Image
Top) Example of a time domain optical coherence tomography (OCT) image obtained in one of the subjects in the study; Bottom) OCT Image after alignment of A-scans.
Figure 2
Figure 2. Retinal Layer Segmentation Steps of Gray-level Mapping and Directional Filtering Applied to a Typical Time Domain OCT Image
Top, left) Two functions (G1 and G2) used for gray-level mapping of the image in Fig. 1; Second row, left) Image after gray-level mapping with G1, depicts boundaries between NFL and IPL+GCL, the junction between photoreceptor inner and outer segments (IS/OS) and RPE; Third row, left) Image after gray-level mapping with G2, depicts the remaining boundaries; Top, right) Frequency response of a wedge-shaped 2-D directional filter; Second row, right) Image displayed in panel B after directional filtering; Third row, right) Image displayed in second row, left, after directional filtering. The IS/OS interface appears flat, because of the initial alignment step.
Figure 3
Figure 3. Retinal Layer Segmentation Step of Edge Detection Applied to a Typical Time Domain OCT Image
Top, left) Edge detection following processing steps displayed in Fig 2 with boundary contour overlaid on the original image. Edge detection following processing steps displayed in Fig 2 with boundary contours overlaid on the original image for: Second row, left) bright to dark transitions and Top, right) dark to bright transitions; Second row, right) Boundary contours are displayed on the image following edge detection;; Bottom) Boundary lines were connected and the gaps filled according to the model; Six retinal layers were segmented and labeled. After RPE boundary detection, the image was aligned again according to the RPE boundary to maintain the curvature of the IS/OS interface.
Figure 4
Figure 4. Retinal Layer Segmentation Method Applied to a Typical Spectral Domain OCT Image
Top, right) Example of a spectral domain optical coherence tomography (OCT) image. Top, left) Image after A-scan alignment. Second row, left) Image after gray-level mapping depicts boundaries between layers; Second row, right) Image after edge detection for dark to bright transitions with boundary contours overlaid on the original image. Third row, left) Image after gray-level mapping depicts NFL boundaries; Third row, right) Image after edge detection for bright to dark transitions with boundary contours overlaid on the original image. Bottom) Boundary lines were connected; Six retinal layers were segmented.
Figure 5
Figure 5. Comparison of Automated and Manual Segmentation Methods
Comparison of thickness profiles of inner retinal layers in 15 normal healthy subjects, derived from the automated algorithm (solid line) and manual segmentation, data averaged for 3 observers (symbols).
Figure 6
Figure 6. Thickness Profiles in Normal Subjects from Time Domain OCT Images
Thickness profiles of inner (top) and outer (bottom) retinal layers measured from time domain OCT image, averaged over 15 normal healthy subjects. Error bars represent standard error of the means.
Figure 7
Figure 7. Thickness Profiles in Normal Subjects from Spectral Domain OCT Images
Thickness profiles of inner (top) and outer (bottom) retinal layers measured from spectral domain OCT image, averaged over 10 normal healthy subjects. Error bars represent standard error of the means.

References

    1. Chan A, Duker JS, Ishikawa H, Ko TH, Schuman JS, Fujimoto JG. Quantification of photoreceptor layer thickness in normal eyes using optical coherence tomography. Retina. 2006;26:655–660. - PMC - PubMed
    1. Ishikawa H, Stein DM, Wollstein G, Beaton S, Fujimoto JG, Schuman JS. Macular segmentation with optical coherence tomography. Invest Ophthalmol Vis Sci. 2005;46:2012–2017. - PMC - PubMed
    1. Koozekanani D, Boyer K, Roberts C. Retinal thickness measurements from optical coherence tomography using a Markov boundary model. IEEE Trans Med Imaging. 2001;20:900–916. - PubMed
    1. Boyer KL, Herzog A, Roberts C. Automatic recovery of the optic nervehead geometry in optical coherence tomography. IEEE Trans Med Imaging. 2006;25:553–570. - PubMed
    1. Mujat M, Chan B, Cense B, et al. Retinal nerve fiber layer thickness map determined from optical coherence tomography images. Optics Express. 2005;13:9480–9491. - PubMed

Publication types