

doi: 10.1016/j.socscimed.2008.07.003.
Epub 2008 Aug 15.
Widening health inequalities among U.S. military retirees since 1974
Affiliations
- PMID: 18708275
- PMCID: PMC2637248
- DOI: 10.1016/j.socscimed.2008.07.003
Item in Clipboard
Widening health inequalities among U.S. military retirees since 1974
Soc Sci Med.
2008 Dec.
Abstract
I explore trends in mortality among U.S. military retirees using a new dataset of payroll records that include pay grade. Trends in mortality by pay grade reveal that health inequalities steadily widened between 1974 and 2004. Additive differentials in mortality rates remained stable, but since mortality declined exponentially, by a factor of about one third, proportional differentials in mortality and thus additive differentials in life expectancy have widened. The advantage in life expectancy enjoyed by retired officers grew roughly from 3 to 4 years. The sources of these trends remain unclear and are beyond the ability of the data to inform, but the results bear implications for trends in inequality and for policy.
Figures
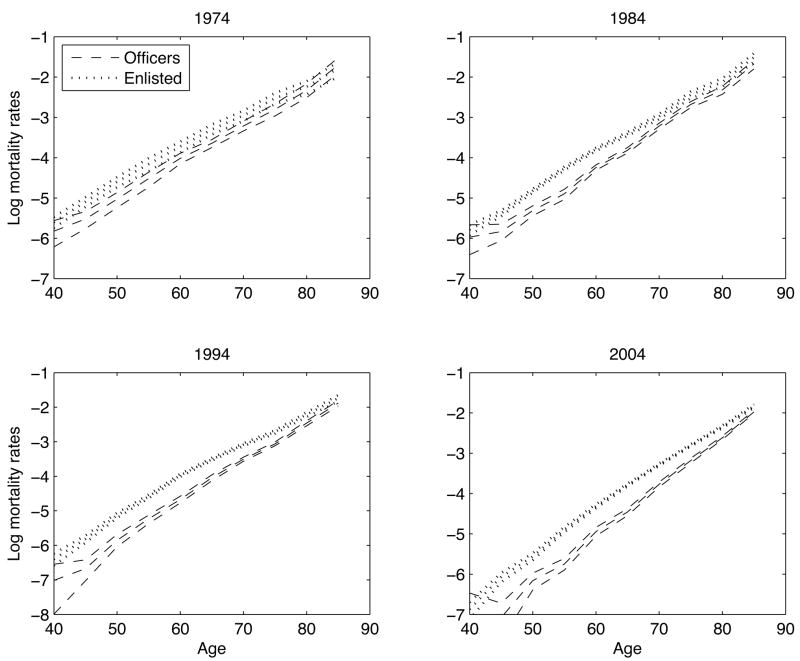
Notes: Each of the four panels shows data for the year specified in its title. In each panel, the three dashed lines depict the 2.5 percentile, median, and 97.5 percentile of the distribution of log mortality rates for retired male officers, while the three dotted lines depict the same centiles for retired enlisted men. Mortality rates are estimated using DMDC payroll data from1974, 1984, 1994, and 2004 as described in the text. The distributions of age-specific mortality rates are generated using Monte Carlo simulations of 1,000 independent draws for each rate, constructed as described in the text.
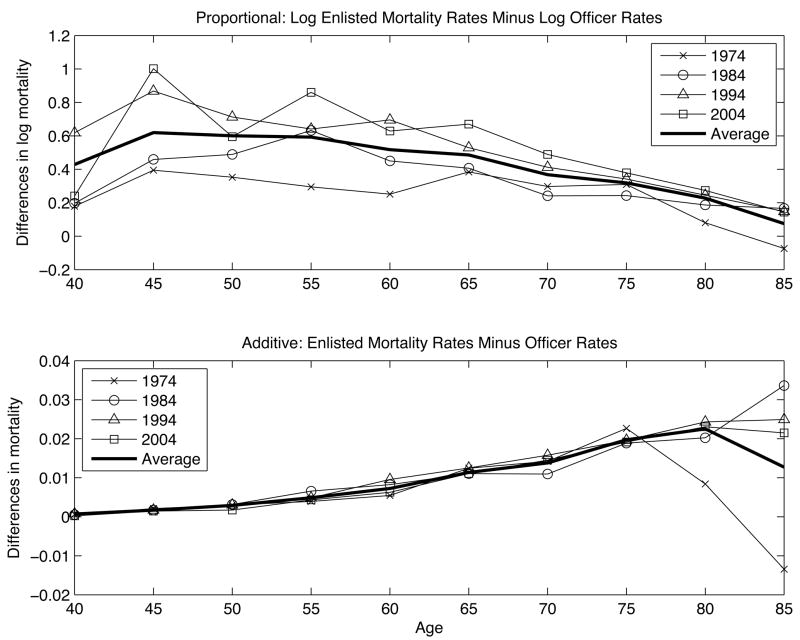
Notes: The top panel shows differences in log mortality rates between retired enlisted men retired officers in 1974, 1984, 1994, and 2004. A positive number represents a higher mortality rate among enlisted retirees by that percentage. The bottom panel shows level differences in mortality rates between the two groups. In each panel, the thick black line depicts the average over all years in the sample. Military retiree rates are estimated by the author using DMDC payroll data.
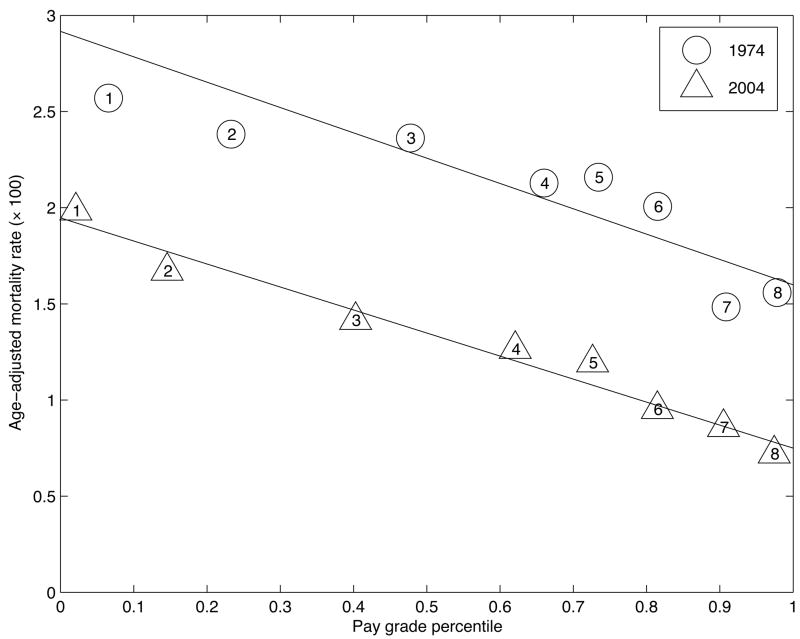
Notes: The data are age-adjusted mortality rates (y-axis) plotted against midpoints of groups’ percentile rankings in the pay distribution. Groups are listed in Table 2 and are composed as follows: (1) E-1 through E-5; (2) E-6; (3) E-7; (4) O-1, W-1, and E-8; (5) O-2, W-2, E-9, and W-3; (6) W-4, O-3, W-5, and O-4; (7) O-5; and (8) O-6 through O-10. Pay grades are grouped according to their pay after 20 years, as shown in Table 2. The SII is the slope of a weighted regression line through points, with population shares as the weights. I construct age-standardized mortality rates for each group by applying the average age structure for all groups combined over the entire sample period to each group’s age-specific mortality rates.
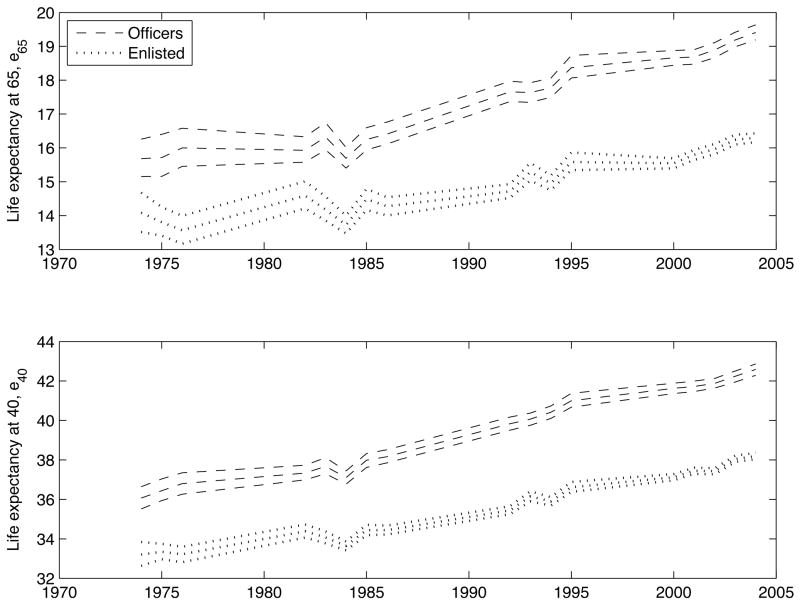
Notes: In each panel of the figure, the set of 3 thin dashed lines show the median and 95 percent confidence intervals around life expectancy for retired officers, while the set of 3 dotted lines show the equivalent for retired enlisted men. Life expectancies for military retirees are constructed from mortality rates estimated using DMDC payroll data for 1974–1976, 1982–1986, 1992–1995, and 2000–2004. Confidence intervals are constructed using Monte Carlo techniques, Bernoulli uncertainty, and uniformly distributed uncertainty about whether undocumented losses are deaths.
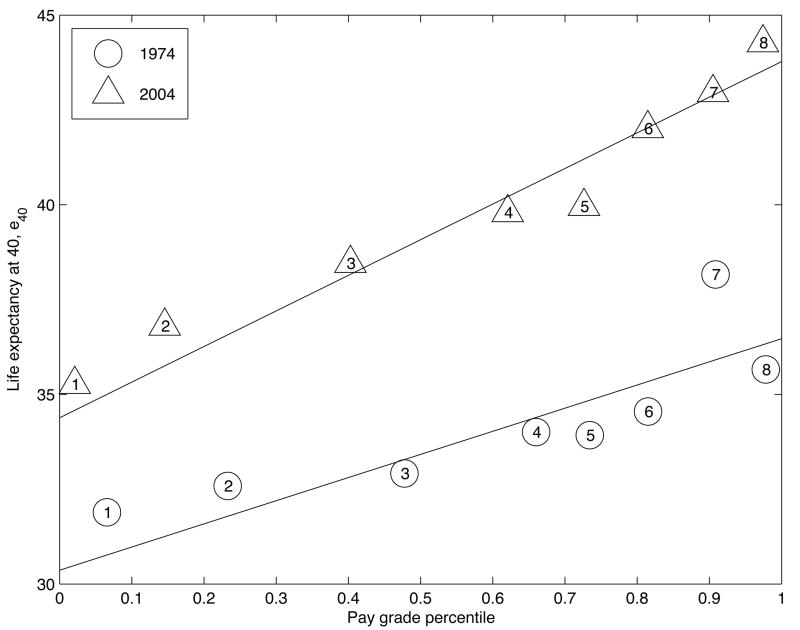
Notes: See notes to Figure 3. These data are period life expectancy at 40 (y-axis).
Similar articles
-
Trends in mortality differentials and life expectancy for male social security-covered workers, by socioeconomic status.Soc Secur Bull. 2007;67(3):1-28. Soc Secur Bull. 2007. PMID: 18605216
-
Contributions of diseases and injuries to widening life expectancy inequalities in England from 2001 to 2016: a population-based analysis of vital registration data.Lancet Public Health. 2018 Dec;3(12):e586-e597. doi: 10.1016/S2468-2667(18)30214-7. Epub 2018 Nov 23. Lancet Public Health. 2018. PMID: 30473483 Free PMC article.
-
Socioeconomic disparities in life expectancy gains among retired German men, 1997-2016.J Epidemiol Community Health. 2019 Jul;73(7):605-611. doi: 10.1136/jech-2018-211742. Epub 2019 Apr 10. J Epidemiol Community Health. 2019. PMID: 30971422 Free PMC article.
-
The Health Effects of Income Inequality: Averages and Disparities.Annu Rev Public Health. 2016;37:413-30. doi: 10.1146/annurev-publhealth-032315-021606. Epub 2016 Jan 6. Annu Rev Public Health. 2016. PMID: 26735427 Review.
-
Population health in an era of rising income inequality: USA, 1980-2015.Lancet. 2017 Apr 8;389(10077):1475-1490. doi: 10.1016/S0140-6736(17)30571-8. Lancet. 2017. PMID: 28402829 Review.
Cited by
-
The Military Health Care System May Have the Potential to Prevent Health Care Disparities.J Racial Ethn Health Disparities. 2015 Sep;2(3):280-9. doi: 10.1007/s40615-014-0067-6. Epub 2014 Dec 6. J Racial Ethn Health Disparities. 2015. PMID: 26863458
-
The Pervasive Role of Rank in the Health of U.S. Veterans.Armed Forces Soc. 2010 Oct 1;36(5):765-785. doi: 10.1177/0095327X09356166. Armed Forces Soc. 2010. PMID: 21113413 Free PMC article.
-
Risk and Protective Factors for Cancer Mortality among United States Service Members and Veterans (2001-2018).Cancer Epidemiol Biomarkers Prev. 2023 May 1;32(5):606-616. doi: 10.1158/1055-9965.EPI-22-0943. Cancer Epidemiol Biomarkers Prev. 2023. PMID: 36880966 Free PMC article.
-
Prevalence of Heart Failure Stages in a Universal Health Care System: The Military Health System Experience.Am J Med. 2023 Nov;136(11):1079-1086.e1. doi: 10.1016/j.amjmed.2023.07.007. Epub 2023 Jul 21. Am J Med. 2023. PMID: 37481019 Free PMC article.
-
Duty, Honor, Country, Disparity: Race/Ethnic Differences in Health and Disability among Male Veterans.Popul Res Policy Rev. 2015 Dec;34(6):785-804. doi: 10.1007/s11113-015-9358-9. Epub 2015 Mar 21. Popul Res Policy Rev. 2015. PMID: 26783376 Free PMC article.
References
-
- Banks James, Marmot Michael, Oldfield Zoe, Smith James P. Disease and Disadvantage in the United States and in England. Journal of the American Medical Association. 2006;295(17):2037–2045. - PubMed
-
- Bedard Kelly, Olivier Deschenes. The Long-Term Impact of Military Service on Health: Evidence from World War II and Korean War Veterans. American Economic Review. 2006;96(1):176–194. - PubMed
-
- Davison Eve H, Pless Anica P, Gugliucci Marilyn R, King Lynda A, King Daniel W, Salgado Dawn M, Spiro Avron, III, Bachrach Peter. Late-Life Emergence of Early-Life Trauma: The Phenomenon of Late-Onset Stress Symptomatology Among Aging Combat Veterans. Research on Aging. 2006;28(1):84–114.
-
- Duleep Harriet Orcutt. Measuring Socioeconomic Mortality Differentials Over Time. Demography. 1989;26(2):345–351. - PubMed
-
- Edwards Ryan D. Working paper. Queens College; CUNY: 2008. Measuring Socioeconomic Differences in Mortality.
Publication types
MeSH terms
Grants and funding
LinkOut - more resources
Full Text Sources
Medical
