

Anomalous diffusion of heterogeneous populations characterized by normal diffusion at the individual level
- PMID: 18708322
- PMCID: PMC2610328
- DOI: 10.1098/rsif.2008.0261
Anomalous diffusion of heterogeneous populations characterized by normal diffusion at the individual level
Abstract
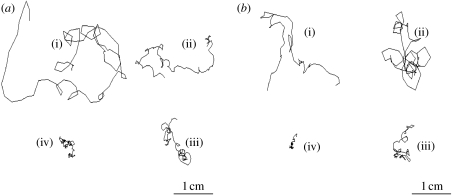
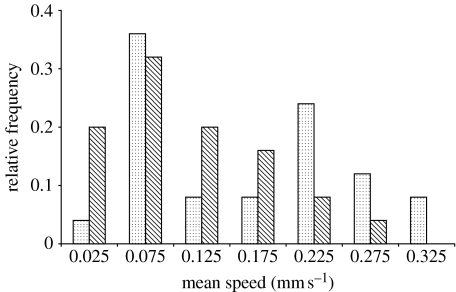
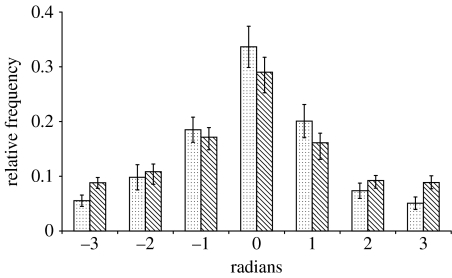
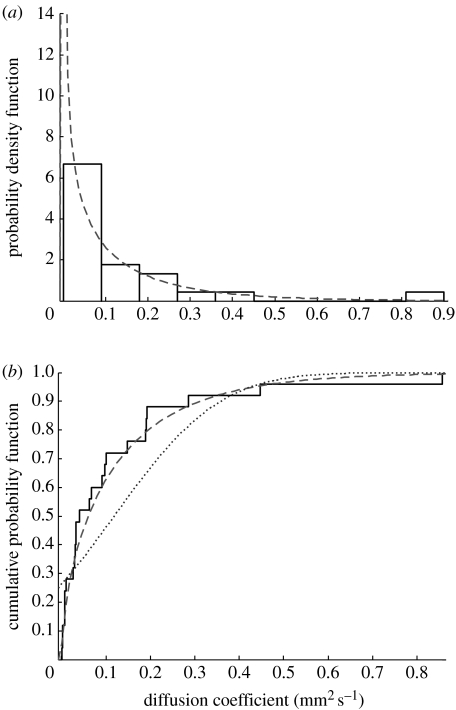
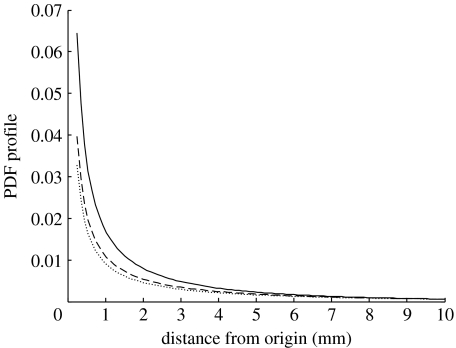
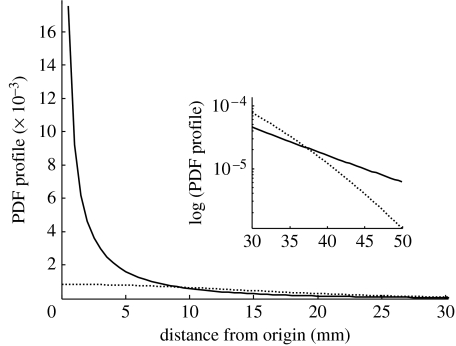
The characterization of the dispersal of populations of non-identical individuals is relevant to most ecological and epidemiological processes. In practice, the movement is quantified by observing relatively few individuals, and averaging to estimate the rate of dispersal of the population as a whole. Here, we show that this can lead to serious errors in the predicted movement of the population if the individuals disperse at different rates. We develop a stochastic model for the diffusion of heterogeneous populations, inspired by the movement of the parasitic nematode Phasmarhabditis hermaphrodita. Direct observations of this nematode in homogeneous and heterogeneous environments reveal a large variation in individual behaviour within the population as reflected initially in the speed of the movement. Further statistical analysis shows that the movement is characterized by temporal correlations and in a heterogeneously structured environment the correlations that occur are of shorter range compared with those in a homogeneous environment. Therefore, by using the first-order correlated random walk techniques, we derive an effective diffusion coefficient for each individual, and show that there is a significant variation in this parameter among the population that follows a gamma distribution. Based on these findings, we build a new dispersal model in which we maintain the classical assumption that individual movement can be described by normal diffusion, but due to the variability in individual dispersal rates, the diffusion coefficient is not constant at the population level and follows a continuous distribution. The conclusions and methodology presented are relevant to any heterogeneous population of individuals with widely different diffusion rates.
Figures
References
-
- Anderson A.R.A, Sleeman B.A, Young I.M, Griffiths B.S. Nematode movement along a chemical gradient in a structurally heterogeneous environment. 2. Theory. Fundam. Appl. Nematol. 1997;20:165–172.
-
- Applebaum D. Cambridge University Press; Cambridge, UK: 2004. Levy processes and stochastic calculus.
-
- Atkinson R.P.D, Rhodes C.J, Macdonald D.W, Anderson R.M. Scale-free dynamics in the movement patterns of jackals. Oikos. 2002;98:134–140. doi: 10.1034/j.1600-0706.2002.980114. - DOI
-
- Batschelet E. Academic Press; London, UK: 1981. Circular statistics in biology.
Publication types
MeSH terms
LinkOut - more resources
Full Text Sources
Other Literature Sources