. 2008 Oct;295(4):H1626-33.
doi: 10.1152/ajpheart.00706.2008. Epub 2008 Aug 15.

Polarity reversal lowers activation time during diastolic field stimulation of the rabbit ventricles: insights into mechanisms

Affiliations

Polarity reversal lowers activation time during diastolic field stimulation of the rabbit ventricles: insights into mechanisms

M M Maleckar et al. Am J Physiol Heart Circ Physiol. 2008 Oct.

Abstract

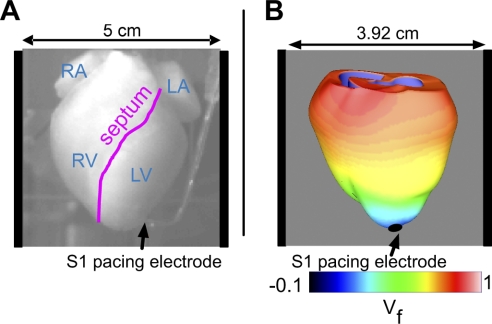
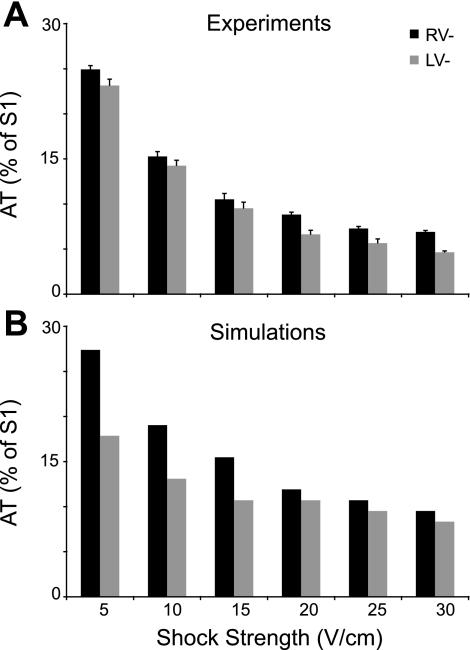
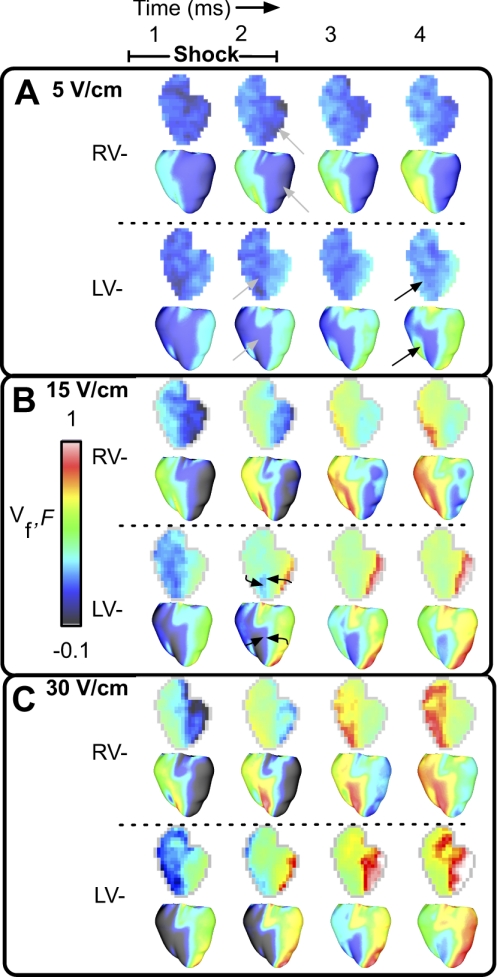
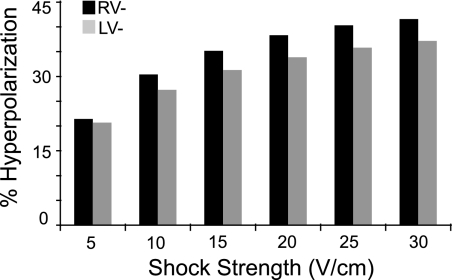
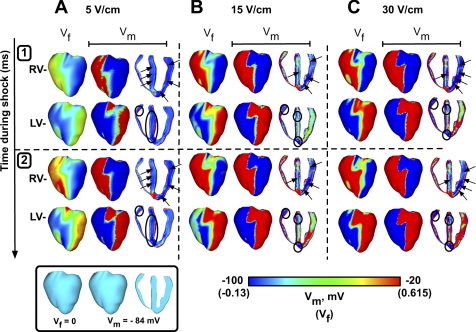
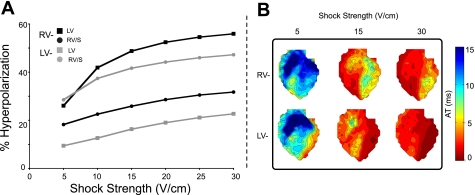
To fully characterize the mechanisms of defibrillation, it is necessary to understand the response, within the three-dimensional (3D) volume of the ventricles, to shocks given in diastole. Studies that have examined diastolic responses conducted measurements on the epicardium or on a transmural surface of the left ventricular (LV) wall only. The goal of this study was to use optical imaging experiments and 3D bidomain simulations, including a model of optical mapping, to ascertain the shock-induced virtual electrode and activation patterns throughout the rabbit ventricles following diastolic shocks. We tested the hypothesis that the locations of shock-induced regions of hyperpolarization govern the different diastolic activation patterns for shocks of reversed polarity. In model and experiment, uniform-field monophasic shocks of reversed polarities (cathode over the right ventricle is RV-, reverse polarity is LV-) were applied to the ventricles in diastole. Experiments and simulations revealed that RV- shocks resulted in longer activation times compared with LV- shocks of the same strength. 3D simulations demonstrated that RV- shocks induced a greater volume of hyperpolarization at shock end compared with LV- shocks; most of these hyperpolarized regions were located in the LV. The results of this study indicate that ventricular geometry plays an important role in both the location and size of the shock-induced virtual anodes that determine activation delay during the shock and subsequently affect shock-induced propagation. If regions of hyperpolarization that develop during the shock are sufficiently large, activation delay may persist until shock end.


Figures

Fig. 1.
Fig. 1.
A: view of the anterior rabbit heart in the experimental setup. The locations of the right atrium (RA), left atrium (LA), right ventricle (RV), left ventricle (LV), and septum are marked. The S1 pacing bipolar electrode is located near the apex, and the shock electrodes are positioned at the right and left sides of the perfusing chamber. B: schematic of the three-dimensional model of the rabbit ventricles with computed optical fluorescence signal (Vf) shown during the repolarization of an S1-paced beat. S1 stimuli are delivered via the apical pacing electrode, as indicated by the black arrow; field shocks are administered via plate electrodes located on either side of the ventricles in the chamber (as represented by the vertical black bars).
Fig. 2.
Fig. 2.
Total epicardial activation time (AT), measured from the onset of the shock until the last pixel (experiment) or myocardial node (simulation) was activated, as a function of shock strength for both RV− and LV− shock polarities in experiments (A) and in simulations (B). Error bars in A indicate the SE of the mean.
Fig. 3.
Fig. 3.
Optical maps of epicardial surface polarization in experiments [fluorescence (F), top rows] and in simulations (Vf, bottom rows) during and after the shock. Postshock timing is indicated at top. Shock strengths are 5 (A), 15 (B), and 30 V/cm (C).
Fig. 4.
Fig. 4.
The total volume of hyperpolarized ventricular myocardium (expressed as a percentage of the total myocardial volume) as a function of shock strength, obtained from the numerical simulations. The total volume of hyperpolarization increases with the increase in shock strength and is greater for RV− shocks.
Fig. 5.
Fig. 5.
Simulation results for 5 (A), 15 (B), and 30 V/cm (C) for the first (top, 1) and second (bottom, 2) milliseconds following shock onset. For each shock strength and time, epicardial Vf (left) and both epicardial (middle) and transmural transmembrane potential (Vm; right) are shown for both RV− (top rows) and LV− shocks (bottom rows).
Fig. 6.
Fig. 6.
A: regional tissue volume of hyperpolarization, assessed as a percentage of the total regional tissue volume, as a function of shock strength for the numerical simulations. B: experimental isochrone maps for shock strengths of 5, 15, and 30 V/cm for both RV− (top row) and LV− (bottom row) shocks. RV/S, RV and septum.

Similar articles

Cited by

References

    1. Anderson C, Trayanova N, Skouibine K. Termination of spiral waves with biphasic shocks: role of virtual electrode polarization. J Cardiovasc Electrophysiol 11: 1386–1396, 2000. - PubMed
    1. Anderson C, Trayanova NA. Success and failure of biphasic shocks: results of bidomain simulations. Math Biosci 174: 91–109, 2001. - PubMed
    1. Ashihara T, Constantino J, Trayanova NA. Tunnel propagation of postshock activations as a hypothesis for fibrillation induction and isoelectric window. Circ Res 102: 737–745, 2008. - PMC - PubMed
    1. Ashihara T, Trayanova NA. Asymmetry in membrane responses to electric shocks: insights from bidomain simulations. Biophys J 87: 2271–2282, 2004. - PMC - PubMed
    1. Bishop MJ, Gavaghan DJ, Trayanova NA, Rodriguez B. Photon scattering effects in optical mapping of propagation and arrhythmogenesis in the heart. J Electrocardiol 40: S75–S80, 2007. - PMC - PubMed

Publication types

Substances

LinkOut - more resources