

Hemoglobin dynamics in red blood cells: correlation to body temperature
- PMID: 18708462
- PMCID: PMC2586580
- DOI: 10.1529/biophysj.108.138040
Hemoglobin dynamics in red blood cells: correlation to body temperature
Abstract
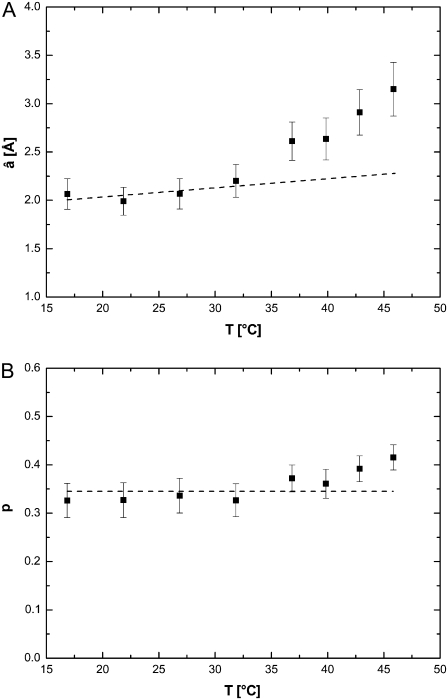
A transition in hemoglobin behavior at close to body temperature has been discovered recently by micropipette aspiration experiments on single red blood cells (RBCs) and circular dichroism spectroscopy on hemoglobin solutions. The transition temperature was directly correlated to the body temperatures of a variety of species. In an exploration of the molecular basis for the transition, we present neutron scattering measurements of the temperature dependence of hemoglobin dynamics in whole human RBCs in vivo. The data reveal a change in the geometry of internal protein motions at 36.9 degrees C, at human body temperature. Above that temperature, amino acid side-chain motions occupy larger volumes than expected from normal temperature dependence, indicating partial unfolding of the protein. Global protein diffusion in RBCs was also measured and the findings compared favorably with theoretical predictions for short-time self-diffusion of noncharged hard-sphere colloids. The results demonstrated that changes in molecular dynamics in the picosecond time range and angstrom length scale might well be connected to a macroscopic effect on whole RBCs that occurs at body temperature.
Figures


Similar articles
-
Hemoglobin senses body temperature.Eur Biophys J. 2009 Jun;38(5):589-600. doi: 10.1007/s00249-009-0410-8. Epub 2009 Feb 24. Eur Biophys J. 2009. PMID: 19238378
-
From powder to solution: hydration dependence of human hemoglobin dynamics correlated to body temperature.Biophys J. 2009 Jun 17;96(12):5073-81. doi: 10.1016/j.bpj.2009.03.043. Biophys J. 2009. PMID: 19527667 Free PMC article.
-
Macromolecular dynamics in red blood cells investigated using neutron spectroscopy.J R Soc Interface. 2011 Apr 6;8(57):590-600. doi: 10.1098/rsif.2010.0306. Epub 2010 Aug 25. J R Soc Interface. 2011. PMID: 20739313 Free PMC article.
-
Entropic elastic processes in protein mechanisms. I. Elastic structure due to an inverse temperature transition and elasticity due to internal chain dynamics.J Protein Chem. 1988 Feb;7(1):1-34. doi: 10.1007/BF01025411. J Protein Chem. 1988. PMID: 3076447 Review.
-
Protein dynamics investigated by neutron scattering.Photosynth Res. 2009 Nov-Dec;102(2-3):281-93. doi: 10.1007/s11120-009-9480-9. Epub 2009 Sep 11. Photosynth Res. 2009. PMID: 19763874 Review.
Cited by
-
Hemoglobin senses body temperature.Eur Biophys J. 2009 Jun;38(5):589-600. doi: 10.1007/s00249-009-0410-8. Epub 2009 Feb 24. Eur Biophys J. 2009. PMID: 19238378
-
The alternative proteome in neurobiology.Front Cell Neurosci. 2022 Nov 17;16:1019680. doi: 10.3389/fncel.2022.1019680. eCollection 2022. Front Cell Neurosci. 2022. PMID: 36467612 Free PMC article. Review.
-
From powder to solution: hydration dependence of human hemoglobin dynamics correlated to body temperature.Biophys J. 2009 Jun 17;96(12):5073-81. doi: 10.1016/j.bpj.2009.03.043. Biophys J. 2009. PMID: 19527667 Free PMC article.
-
Interaction of blood plasma proteins with superhemophobic titania nanotube surfaces.Nanomedicine. 2019 Oct;21:102046. doi: 10.1016/j.nano.2019.102046. Epub 2019 Jul 3. Nanomedicine. 2019. PMID: 31279063 Free PMC article.
-
Dynamical Behavior of Human α-Synuclein Studied by Quasielastic Neutron Scattering.PLoS One. 2016 Apr 20;11(4):e0151447. doi: 10.1371/journal.pone.0151447. eCollection 2016. PLoS One. 2016. PMID: 27097022 Free PMC article.
References
-
- Austin, R. H., K. W. Beeson, L. Eisenstein, H. Frauenfelder, and I. C. Gunsalus. 1975. Dynamics of ligand binding to myoglobin. Biochemistry. 14:5355–5373. - PubMed
-
- Creighton, T. E. 1992. Proteins: Structures and Molecular Properties. W.H. Freeman, New York.
-
- Brooks III, C. L., M. Karplus, and B. M. Pettitt. 1988. Proteins: A Theoretical Perspective of Dynamics, Structure, and Thermodynamics. John Wiley & Sons, New York.
-
- Frauenfelder, H., F. Parak, and R. D. Young. 1988. Conformational substates in proteins. Annu. Rev. Biophys. Biophys. Chem. 17:451–479. - PubMed
-
- Fraunfelder, H., S. G. Sligar, and P. G. Wolynes. 1991. The energy landscapes and motions of proteins. Science. 254:1598–1603. - PubMed
Publication types
MeSH terms
Substances
LinkOut - more resources
Full Text Sources
