. 2008 Aug 15;22(16):2178-88.
doi: 10.1101/gad.1690808.

Tumorigenic activity and therapeutic inhibition of Rheb GTPase

Affiliations

Tumorigenic activity and therapeutic inhibition of Rheb GTPase

Konstantinos J Mavrakis et al. Genes Dev. .

Abstract

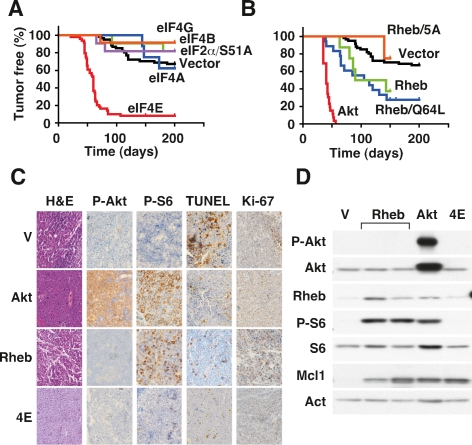
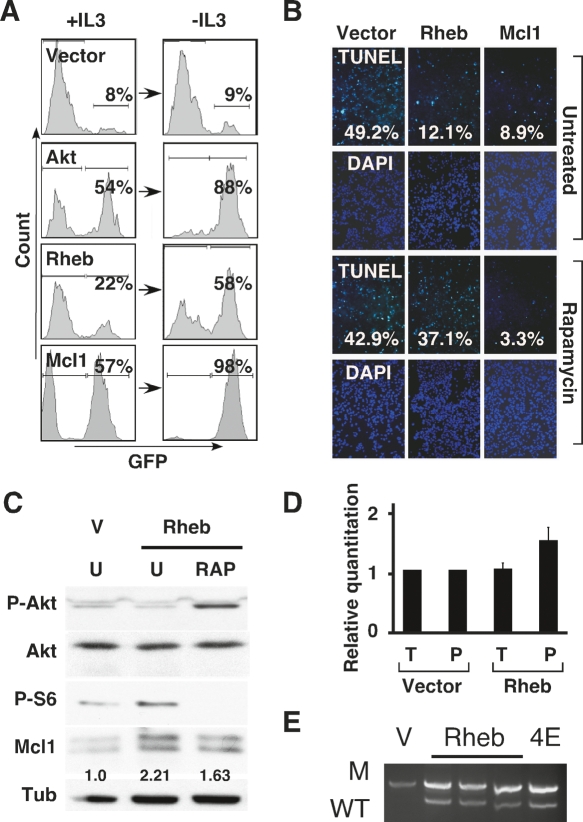
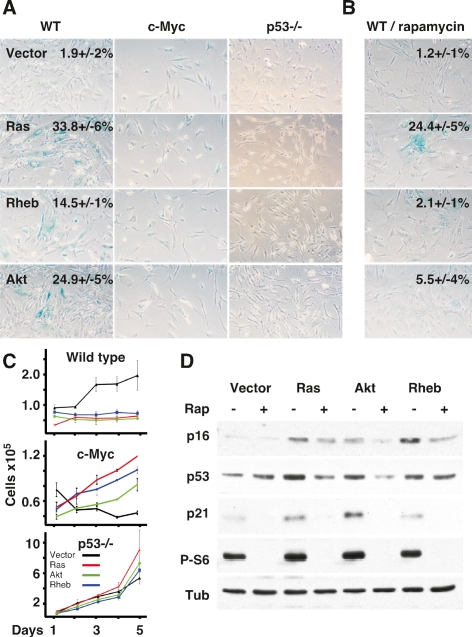
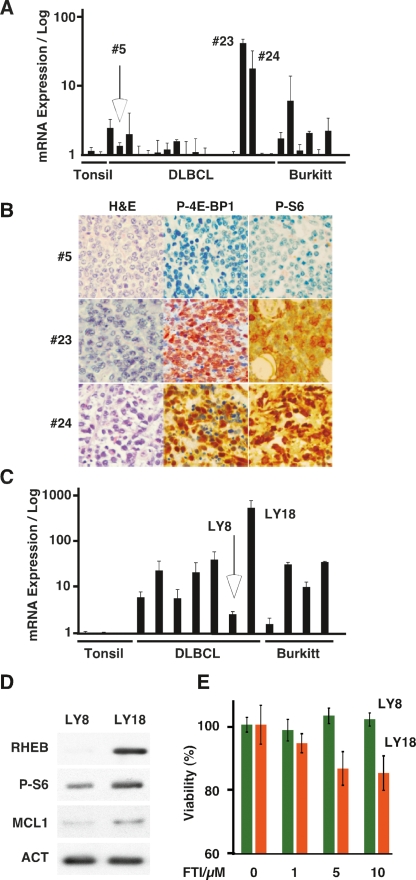
The AKT-mTOR pathway harbors several known and putative oncogenes and tumor suppressors. In a phenotypic screen for lymphomagenesis, we tested candidate genes acting upstream of and downstream from mTOR in vivo. We find that Rheb, a proximal activator of mTORC1, can produce rapid development of aggressive and drug-resistant lymphomas. Rheb causes mTORC1-dependent effects on apoptosis, senescence, and treatment responses that resemble those of Akt. Moreover, Rheb activity toward mTORC1 requires farnesylation and is readily blocked by a pharmacological inhibitor of farnesyltransferase (FTI). In Pten-deficient tumor cells, inhibition of Rheb by FTI is responsible for the drug's anti-tumor effects, such that a farnesylation-independent mutant of Rheb renders these tumors resistant to FTI therapy. Notably, RHEB is highly expressed in some human lymphomas, resulting in mTORC1 activation and increased sensitivity to rapamycin and FTI. Downstream from mTOR, we examined translation initiation factors that have been implicated in transformation in vitro. Of these, only eIF4E was able to enhance lymphomagenesis in vivo. In summary, the Rheb GTPase is an oncogenic activity upstream of mTORC1 and eIF4E and a direct therapeutic target of farnesyltransferase inhibitors in cancer.


Figures

Figure 1.
Figure 1.
In vivo candidate screen for lymphomagenesis identifies the tumorigenic activity of Rheb GTPase. (A,B) Kaplan-Meier plots showing the latency to tumor development in mice reconstituted with retrovirally transduced Eμ-Myc HPCs, where day 0 is the day of HPC transplantation. A shows eIF4E (red; n = 50), eIF4B (green; n = 11), eIF4AI (blue; n = 8), eIF2α/S51A (purple; n = 11), eIF4GI (orange; n = 12) and vector control (black; n = 62); includes mice analyzed in parallel and historic controls.B shows myrAkt (Akt; red; n = 24), Rheb (green; n = 9); Rheb/Q64L (blue; n = 18), Rheb/5A (orange; n = 6), and vector control (as in A). (C) Representative micrographs of the indicated Eμ-Myc lymphomas (Control: V; Rheb/Q64L: Rheb; myrAkt: Akt; eIF4E: 4E) stained with hematoxylin and eosin (H&E), antibodies against phosphorylated Akt (Ser473) (P-Akt), phosphorylated ribosomal S6 protein (Ser240/244) (P-S6), or TUNEL and Ki-67. (D) Immunoblot of lysates prepared from Eμ-Myc lymphomas (V) and Eμ-Myc lymphomas expressing Rheb/Q64L (Rheb), myrAkt (Akt), and eIF4E (4E) probed with the indicated antibodies.
Figure 2.
Figure 2.
Rheb opposes apoptosis in an mTORC1-dependent manner. (A) Flow cytometric analysis of mixed FL5-12 cell populations partially transduced with vectors coexpressing GFP (vector) and either myrAkt (Akt), Rheb/Q64L (Rheb), or Mcl1. Indicated are the percentages of GFP expressing cells before (+IL3) and after (−IL3) IL3-withdrawal. (B) TUNEL and DAPI stains of primary MEFs transduced with c-Myc and either vector, Rheb/Q64L (Rheb), or Mcl1 24 h after apoptosis was triggered by serum withdrawal in the presence or absence of 100 nM rapamycin; quantification of TUNEL positive cells is indicated. (C) Immunoblot of lysates prepared from MEFs transduced with empty vector or Rheb/Q64L (Rheb), either untreated (U) or rapamycin-treated (RAP), and probed with antibodies against phosphorylated Akt (Ser473), phosphorylated ribosomal S6 (Ser240/244), Mcl1, or tubulin. Indicated is the relative quantification of Mcl1 protein levels. (D) Quantitative real-time RT–PCR of Mcl1 normalized to β-actin from cDNA samples prepared from MEFs transduced with vector or Rheb/Q64L (Rheb). Shown is a “relative quantification” whereby the Mcl1 expression in triplicates of the total and polysome samples from vector transduced cells is set to 1 and compared with the total and polysome fraction from cells expressing Rheb/Q64L. (E) Allele-specific PCR to detect the wild-type p53 (WT) and mutant (M) allele in tumors derived from Eμ-Myc/p53+/− HSCs transduced with vector (V), Rheb/Q64L (Rheb) or eIF4E (4E).
Figure 3.
Figure 3.
Rheb induces cellular senescence in a p53, mTORC1-dependent, and c-Myc-sensitive manner. (A) Representative micrographs of wild-type (WT), p53−/−, and c-Myc-expressing MEFs transduced with vector, Ras/V12 (Ras), Rheb/Q64L (Rheb), or myrAkt (Akt) and stained for senescence-associated β-galactosidase (SA β-Gal) activity. The mean and standard deviation of the percentages of SA-β Gal-positive cells are indicated; no number indicates mean <1%. (B) Wild-type MEFs (WT) transduced with the same expression constructs and treated with 100 nM rapamycin. Mean and standard deviation (n = 3) of SA β-Gal-positive cells for untreated and rapamycin-treated wild-type MEFs is indicated. (C) Growth curves of wild-type, p53−/−-, and c-Myc-expressing MEFs expressing vector (black line), Rheb/Q64L (Rheb; blue line), Ras/V12 (Ras; red line), or myrAkt (Akt; green line). (D) Immunoblot of lysates prepared from wild-type MEFs transduced with the indicated alleles and either left untreated (−) or treated with 100 nM rapamycin (+) and probed for the indicated proteins.
Figure 4.
Figure 4.
Rapamycin reverses Rheb-mediated resistance to chemotherapy. Kaplan-Meier analyses of survival to preterminal condition in mice that were injected with control (Eμ-Myc/Arf−/−; black lines), Rheb/Q64L (Rheb; green lines), and myrAkt lymphoma cells (Akt; red lines). Treatment was initiated upon detection of well-palpable tumors on day 0. (A) Doxorubicin treatment (10 mg/kg) on day 1 of mice bearing control (n = 19), Akt (n = 16), and Rheb (n = 8) lymphoma. (B) Rapamycin treatment (4 mg/kg) on days 1, 3, and 5 of control (n = 11), Akt (n = 14), and Rheb lymphoma (n = 8). (C) Combination therapy with doxorubicin (10 mg/kg on day 1) and rapamycin (4 mg/kg on days 1, 3, and 5) of mice harboring control (n = 22), Akt (n = 15), and Rheb (n = 10) tumors. Treatment with rapamycin and doxorubicin significantly prolonged survival in mice bearing Akt- and Rheb-expressing tumors.
Figure 5.
Figure 5.
Rheb inhibition by FTIs is responsible for FTI’s anti-tumor effect in Pten-deficient lymphoma. (A) Immunoblot of lysates prepared from Arf−/− lymphocytes expressing Rheb/Q64L or Rheb/Q64L/M184L (Rheb/M184L) and either untreated (U) or treated with 100nM rapamycin (R) for 6 h, or 20 μM FTI-277 for 24 h (F) and probed with antibodies against phosphorylated (Ser240/244) and total ribosomal S6 and tubulin. (B) Flow cytometric analysis of Eμ-Myc/Pten+/− and Eμ-Myc/Arf−/− tumor cells at different times after treatment with FTI-277 (20 μM). Indicated is the fraction of viable cells of all nucleated cells. (C) Flow cytometric analysis of mixed PTEN+/− or Arf−/− lymphoma cell populations partially transduced with vectors coexpressing GFP and either Rheb/Q64L, the farnesylation-independent mutant Rheb/Q64L/M184L (Rheb/M184L) or Mcl1. Indicated are the percentages of GFP-expressing cells before and after treatment with FTI-277 (30 μM/48 h).
Figure 6.
Figure 6.
RHEB expression and drug sensitivity in human lymphoma. (A) Quantitative real-time RT–PCR analysis of RHEB expression from cDNAs prepared from reactive tonsils (tonsil), a collection of DLBCL, and some cases of Burkitt’s (Burkitt) lymphoma. (B) Representative micrographs of lymphomas #5, #23, and #24 representing low and high RHEB mRNA-expressing lymphoma in A. Samples are stained with hematoxylin and eosin (H&E), and antibodies against the indicated antigens. (C) Quantitative real-time RT–PCR analysis of RHEB expression in human lymphoma cells lines representing DLBCL and Burkitt’s lymphoma compared with reactive tonsils. (D) Immunoblot of lysates prepared from low (LY8) and high (LY18) RHEB-expressing DLBCL lines probed with the indicated antibodies. (E) Mean and standard deviation of viability of LY8 and LY18 human lymphoma lines treated with FTI-277 at the indicated concentrations for 48 h.

References

    1. Avdulov S., Li S., Michalek V., Burrichter D., Peterson M., Perlman D.M., Manivel J.C., Sonenberg N., Yee D., Bitterman P.B., et al. Activation of translation complex eIF4F is essential for the genesis and maintenance of the malignant phenotype in human mammary epithelial cells. Cancer Cell. 2004;5:553–563. - PubMed
    1. Basso A.D., Mirza A., Liu G., Long B.J., Bishop W.R., Kirschmeier P. The farnesyl transferase inhibitor (FTI) SCH66336 (lonafarnib) inhibits Rheb farnesylation and mTOR signaling. Role in FTI enhancement of taxane and tamoxifen anti-tumor activity. J. Biol. Chem. 2005;280:31101–31108. - PubMed
    1. Braun T., Fenaux P. Farnesyltransferase inhibitors and their potential role in therapy for myelodysplastic syndromes and acute myeloid leukaemia. Br. J. Haematol. 2008;141:576–586. - PubMed
    1. Buerger C., DeVries B., Stambolic V. Localization of Rheb to the endomembrane is critical for its signaling function. Biochem. Biophys. Res. Commun. 2006;344:869–880. - PubMed
    1. Burnett A.K., Kell J. Tipifarnib in acute myeloid leukemia. Drugs Today (Barc) 2007;43:795–800. - PubMed

Publication types

MeSH terms

Substances