. 2008 Oct;295(4):L658-69.
doi: 10.1152/ajplung.90233.2008. Epub 2008 Aug 15.

Role of P63 (CKAP4) in binding of surfactant protein-A to type II pneumocytes

Affiliations

Role of P63 (CKAP4) in binding of surfactant protein-A to type II pneumocytes

Sandra R Bates et al. Am J Physiol Lung Cell Mol Physiol. 2008 Oct.

Abstract

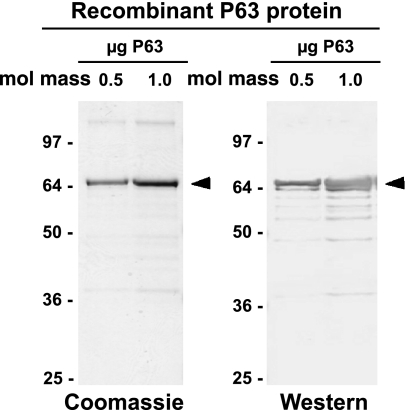
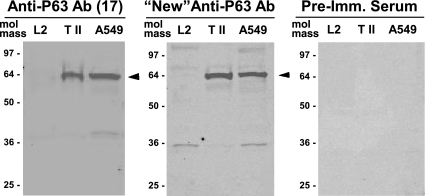
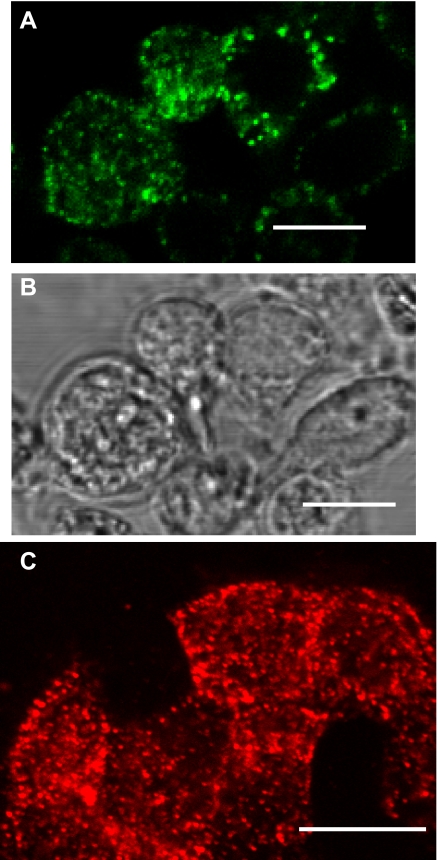
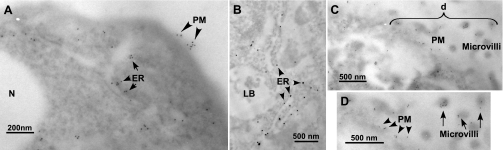
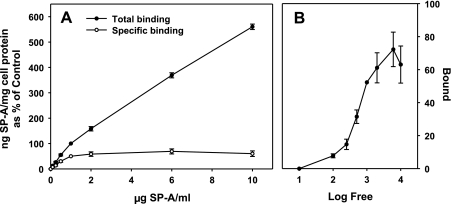
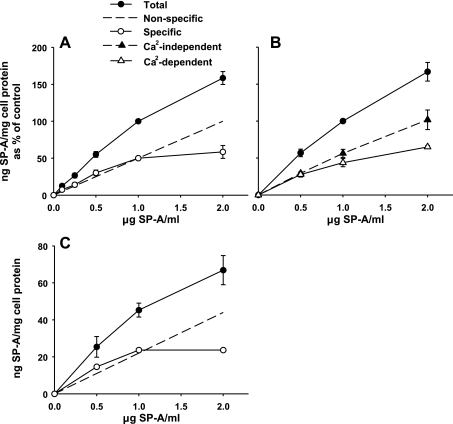
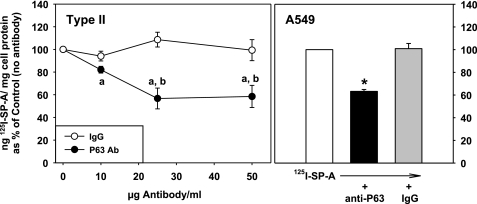
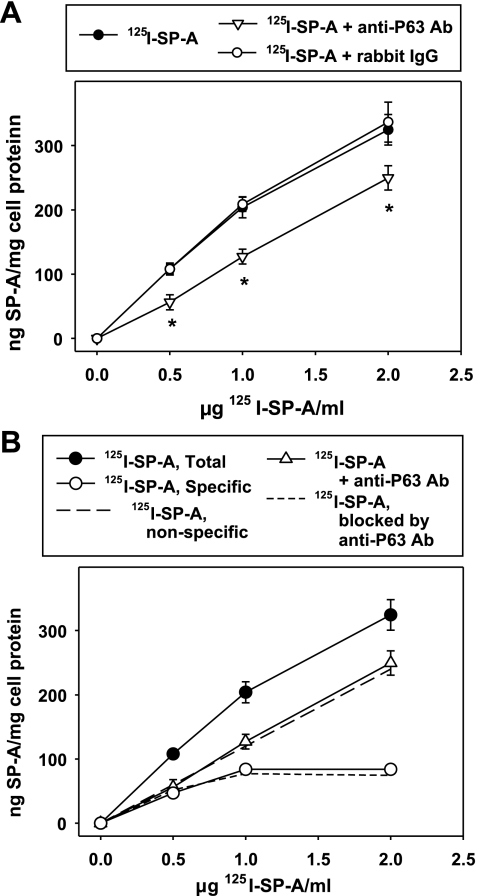
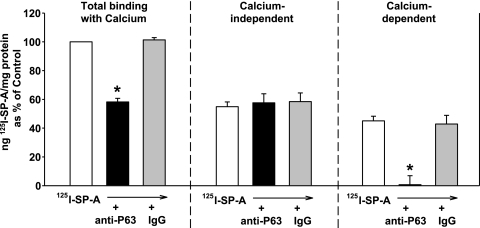
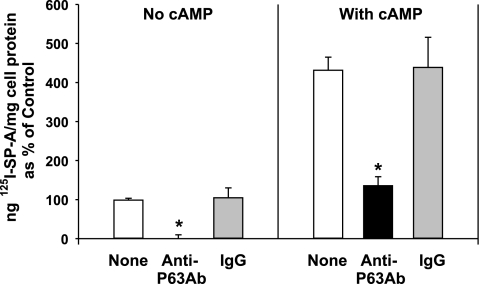
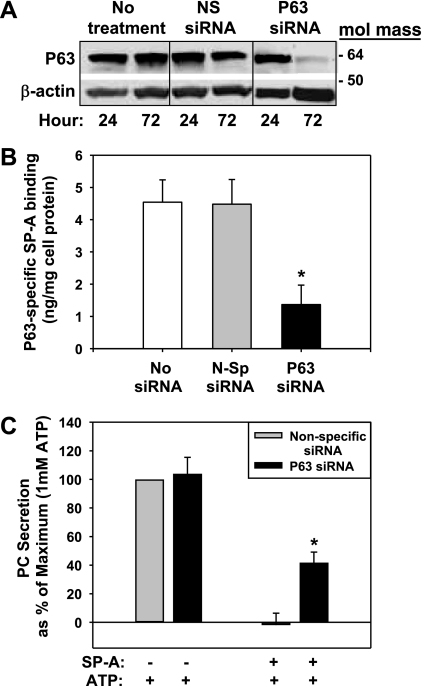
We have recently described a putative receptor for lung surfactant protein-A (SP-A) on rat type II pneumocytes. The receptor, P63, is a 63-kDa type II transmembrane protein. Coincubation of type II cells with P63 antibody (Ab) reversed the inhibitory effect of SP-A on secretagogue-stimulated surfactant secretion from type II cells. To further characterize SP-A interactions with P63, we expressed recombinant P63 protein in Escherichia coli and generated antibodies to P63. Immunogold electron microscopy confirmed endoplasmic reticulum and plasma membrane localization of P63 in type II cells with prominent labeling of microvilli. Binding characteristics of iodinated SP-A to type II cells in the presence of P63 Ab were determined. Binding (4 degrees C, 1 h) of (125)I-SP-A to type II cells demonstrated both specific (calcium-dependent) and nonspecific (calcium-independent) components. Ab to P63 protein blocked the specific binding of (125)I-SP-A to type II cells and did not change the nonspecific SP-A association. A549 cells, a pneumocyte model cell line, expressed substantial levels of P63 and demonstrated specific binding of (125)I-SP-A that was inhibited by the P63 Ab. The secretagogue (cAMP)-stimulated increase in calcium-dependent binding of SP-A to type II cells was blocked by the presence of P63 Ab. Transfection of type II cells with small interfering RNA to P63 reduced P63 protein expression, attenuated P63-specific SP-A binding, and reversed the ability of SP-A to prevent surfactant secretion from the cells. Our results further substantiate the role of P63 as an SP-A receptor protein localized on the surface of lung type II cells.


Figures

Fig. 1.
Fig. 1.
Recombinant P63, a 63-kDa type II transmembrane protein. Recombinant human P63 protein with a His tag on both ends was expressed in Escherichia coli, purified using nickel-agarose affinity chromatography and visualized using gel electrophoresis. A similar preparation of P63 run on slab gels was used for antibody (Ab) production in rabbits. Left: expressed P63 stained with Coomassie blue. Right: Western blot of the expressed P63 visualized using the rabbit P63 Ab. Arrowheads indicate the P63 protein band. Values under mol mass are in kilodaltons.
Fig. 2.
Fig. 2.
P63 protein is present in rat type II cells and human A549 cells. Western blot analysis was performed on whole cell lysates from the rat L2 and the human A549 alveolar epithelial cell lines and the freshly isolated type II cells (T II) after 24 h in culture. After gel electrophoresis and transfer to nitrocellulose, the blots were probed with P63 Ab used previously (left; Ref. 17), newly prepared P63 Ab (middle), and preimmune (Pre-Imm.) rabbit serum (right). Arrowheads indicate the P63 protein band.
Fig. 3.
Fig. 3.
Immunolocalization of P63 in isolated rat type II cells. Type II cells were either left unpermeabilized (A and B) or were permeabilized (C) and incubated with P63 Ab. A: immunofluorescence of Alexa 488 (green)-conjugated secondary Ab. B: phase contrast microscopy of cells in A. C: immunofluorescence of Alexa 594 (red)-conjugated secondary Ab. Scale bar = 10 μm.
Fig. 4.
Fig. 4.
P63 localization in type II cells at the electron micrographic level. Type II cells were incubated with surfactant protein-A (SP-A; 1 μg/ml) for 2 h, fixed, and incubated with P63 Ab followed by gold-conjugated goat anti-rabbit Ab. D is enlargement of area (“d”) shown in C. Gold particles (10-nm size in A, C, and D; 15-nm size in B) marking P63 proteins were found in structures consistent with endoplasmic reticulum (ER) (A, short arrows; B, arrowheads), plasma membrane (PM) [A, C, and D (A and D, arrowheads)], and on microvilli [C and D (D, long arrows)]. LB, lamellar body; N, nucleus.
Fig. 5.
Fig. 5.
Concentration-dependent binding of SP-A to type II cells. Increasing concentrations of 125I-SP-A were incubated with pneumocyte cells plated on 12-well plates at 4°C for 1 h followed by harvest with 2 N NaOH. A: SP-A binding to type II cells. Total binding (closed circles) was measured in the presence of calcium. Specific binding (open circles) was determined by the “slope-peeling” method (16) where the nonspecific portion of the binding curve is subtracted from the total binding curve. Data are means ± SE of 3–8 experiments performed in duplicate or triplicate expressed as a percentage of the nanograms of SP-A per milligram of cell protein bound at 1 μg of 125I-SP-A/ml. Total binding at 1 μg SP-A/ml (100% value) was 104.5 ± 30.4 ng SP-A/mg cell protein (mean ± SE, n = 8) with a range of 40–279 ng SP-A/mg cell protein. B: Klotz plot of the specific binding of SP-A. The log of the concentration of free SP-A (μg/ml) is plotted vs. the amount of SP-A specifically bound (ng SP-A/mg cell protein) to the cells normalized to the mean binding value at 1 μg SP-A/ml for the 8 experiments (104.5 ng SP-A/mg cell protein).
Fig. 6.
Fig. 6.
Binding characteristics of SP-A to type II pneumocytes and A549 cells. Increasing concentrations of 125I-SP-A were incubated at 4°C, 1 h. The cells were harvested with 2 N NaOH. A: type II cells. The total binding data of SP-A to type II cells (closed circles) at SP-A concentrations from 0.1 to 2 μg SP-A/ml are replotted from Fig. 5A. The specific binding (open circles) was determined by the slope-peeling method (16) where nonspecific portion of the binding curve (long, dashed line) is subtracted from the total binding curve. Data are the means ± SE of 3–8 experiments performed in duplicate or triplicate. B: type II cells. Binding was performed in HBSS with (total binding, closed circles) or without calcium (Ca2-independent, closed triangles). The calcium-dependent binding (open triangles) was determined by subtraction of the total binding from the calcium-independent binding. The data are the ng SP-A/mg cell protein expressed as a percentage of the binding at 1 μg SP-A/ml. 100% = 68.9 ± 18.9 ng SP-A/mg cell protein (mean ± SE, n = 3). C: A549 cells. Binding was performed in MEM. Total binding (closed circles) was measured. Specific binding (open circles) was determined by the slope-peeling method (16) as described in A. Data are ng SP-A/mg cell protein (means ± SE of 3 experiments performed in duplicate).
Fig. 7.
Fig. 7.
Ab to P63 inhibits the binding of SP-A to lung epithelial cells. Type II cells: cells were incubated without or with increasing concentrations of P63 Ab or nonimmune IgG for 15 min followed by the addition of 125I-SP-A (1 μg/ml) for 1 h at 4°C. The cells were harvested, and the binding of SP-A (ng 125I-SP-A/mg cell protein) was expressed as a percentage of the binding in the absence of Ab (171 ± 45 ng 125ISP-A/mg cell protein), which was set equal to 100%. Data are means ± SE, n = 3. “a,” Statistically significant difference from no Ab (100%); “b,” statistically significant difference from IgG. P < 0.05. A549 cells. Cells were incubated with no additions or with P63 Ab or IgG (25 μg protein/ml) for 15 min followed by the addition of 125I-SP-A (0.5 μg/ml) for 1 h at 4°C. The binding of SP-A (ng 125I-SP-A/mg cell protein) was expressed as a percentage of the binding in the absence of Ab (27.6 ± 2.3 ng 125I SP-A/mg cell protein), which was set equal to 100%. Data are means ± SE, n = 3. *Statistically significant difference from either no Ab or nonimmune IgG. P < 0.05.
Fig. 8.
Fig. 8.
The specific binding of SP-A to type II cells is blocked by P63 Ab. Type II cells were incubated with P63 Ab or nonimmune IgG (25 μg protein/ml) for 15 min followed by addition of increasing concentrations of 125I-SP-A for 1 h at 4°C. A: total binding of SP-A. Data are means ± SE of 3 experiments performed in duplicate. *Statistically significant difference from binding of SP-A alone or with rabbit nonimmune IgG. B: binding of 125I-SP-A in A expressed as total, nonspecific, and specific binding. The nonspecific SP-A binding data reflects the binding of SP-A in the presence of P63 Ab. The specific SP-A binding curve can be superimposed on the amount of SP-A blocked by the presence of P63 Ab [determined by subtracting the binding of SP-A with anti-P63 Ab present (open triangles) from that without additions (closed circles)].
Fig. 9.
Fig. 9.
The calcium-dependent binding of SP-A is inhibited by P63 Ab. Type II cells were incubated in HBSS without or with calcium (1 mM). Anti-P63 or nonimmune IgG was added for 15 min followed by the addition of 125I-SP-A (0.5 μg/ml) for 1 h at 4°C. The cells were harvested, and the calcium-dependent binding was determined by subtracting the binding in the absence of calcium (calcium-independent) from the total binding (with calcium). Data are the means ± SE (n = 3) expressed as a percentage of total binding with calcium (Control). Control = 111 ± 31 ng 125I-SP-A/mg cell protein. *Statistically significant difference from binding without additions or with IgG. P < 0.05.
Fig. 10.
Fig. 10.
The secretagogue-stimulated increase in calcium-dependent SP-A binding is attenuated by Ab directed against P63 protein. Type II cells were placed on Transwell membranes and incubated for 24 h in HBSS without or with calcium (1 mM). Anti-P63 or nonimmune IgG was added for 15 min followed by the addition of 125I-SP-A (0.5 μg/ml) for 1 h at 4°C. The cells were harvested, and the calcium-dependent binding was determined by subtracting the binding in the absence of calcium (calcium-independent) from the total binding with calcium. Data are the means ± SE of 3–9 experiments performed in triplicate expressed as percentage of the calcium-dependent binding (20.5 ± 0.8 ng 125I-SP-A/mg cell protein, n = 9), which was set equal to 100% (Control, no cAMP). *Statistically significant difference from binding without additions or with IgG. P < 0.05.
Fig. 11.
Fig. 11.
Small interfering RNA (siRNA) knockdown of P63 expression reduced type II cell interactions with SP-A. Type II cells were transfected with nonspecific (NS or N-Sp siRNA) or P63-specific siRNA (P63 siRNA). [3H]choline was added to some dishes to label phosphatidylcholine (PC). A: Western blot for P63. The cells were cultured for 24 or 72 h and harvested, and lysates were subjected to Western blotting procedures using either P63 or β-actin Ab. The latter served as a loading control. No treatment, no siRNA added. B: P63-specific SP-A binding. At 72 h posttransfection, the cells were incubated (4°C, 1 h) with 0.5 μg/ml 125I SP-A without or with 25 μg/mg anti-P63 polyclonal Ab to block specific binding of SP-A to the cells. The cells were harvested with 0.2 N NaOH and counted. The data are the ng 125I-SP-A/mg cell protein bound to the cells that were inhibited by the anti-P63 Ab (SP-A binding with anti-P63 Ab subtracted from binding without anti-P63 Ab), thus representing P63-specific binding of SP-A. The total binding of SP-A to untreated cells (no siRNA) in the absence of Ab was low (15.3 ± 1.2 ng 125I-SP-A/mg cell protein, n = 3), possibly due to the fact that transdifferentiation of type II to type I cells after 72 h of culture (6, 15) may have affected the cell surface density of P63. Data are the means ± SE of triplicate determinations. *Statistically significant difference from no siRNA and nonspecific siRNA, P < 0.05. C: PC secretion. After 72 h, the cells that were previously incubated with [3H]choline were exposed to ATP (1 mM) ± SP-A (0.2 μg/ml) for 1 h. 3H-PC was extracted from cells and media and analyzed. Basal secretion was subtracted from all data = 0% maximum. Data are expressed as a percentage of PC secretion that occurred with nonspecific siRNA + ATP alone (1.75% ± 0.21% PC secretion, mean ± SE, n = 3), which was set equal to 100% (maximum). Data are means ± SE of duplicate or triplicate samples from 3 experiments. *Statistically significant difference from nonspecific siRNA (+ SP-A + ATP), P < 0.05; n = 3.

References

    1. Bates SR, Dodia C, Fisher AB. Surfactant protein A regulates uptake of pulmonary surfactant by lung type II cells on microporous membranes. Am J Physiol Lung Cell Mol Physiol 267: L753–L760, 1994. - PubMed
    1. Bates SR, Dodia C, Tao JQ, Fisher AB. Surfactant protein-A plays an important role in lung surfactant clearance: evidence using the surfactant protein-A gene-targeted mouse. Am J Physiol Lung Cell Mol Physiol 294: L325–L333, 2008. - PubMed
    1. Bates SR, Tao JQ, Notarfrancesco K, DeBolt K, Shuman H, Fisher AB. Effect of surfactant protein A on granular pneumocyte surfactant secretion in vitro. Am J Physiol Lung Cell Mol Physiol 285: L1055–L1065, 2003. - PubMed
    1. Bligh EG, Dyer WJ. A rapid method of total lipid extraction and purification. Can J Med Sci 37: 911–917, 1959. - PubMed
    1. Bradford M A rapid and sensitive method for quantitation of microgram quantities of proteins utilizing the principle of protein dye binding. Anal Biochem 72: 248–254, 1976. - PubMed

Publication types

LinkOut - more resources