

Comparison of different methods for spatial analysis of cancer data in Utah
- PMID: 18709141
- PMCID: PMC2516561
- DOI: 10.1289/ehp.10815
Comparison of different methods for spatial analysis of cancer data in Utah
Abstract
Background: The standardized incidence ratio (SIR) and SaTScan software are used by the Environmental Epidemiology Program (EEP), Utah Department of Health, to investigate health concerns and exposures in Utah (USA). Recently, the EEP acquired the Rapid Inquiry Facility (RIF). The RIF enables access of additional dimensions of data, identifies potentially exposed populations, and computes disease rates and relative risk statistics for that potentially exposed population.
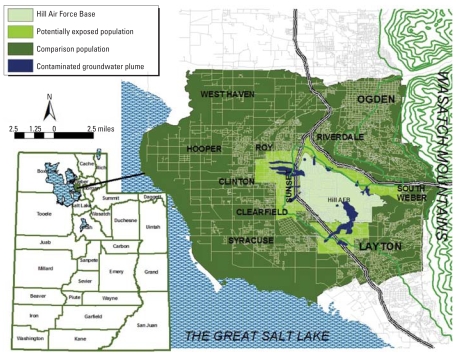
Objective: In this article we present a comparison of the SIR, SaTScan, and RIF methodologies in an investigation of cancer rates in residents living over contaminated groundwater plumes near Hill Air Force Base (HAFB) in Utah.
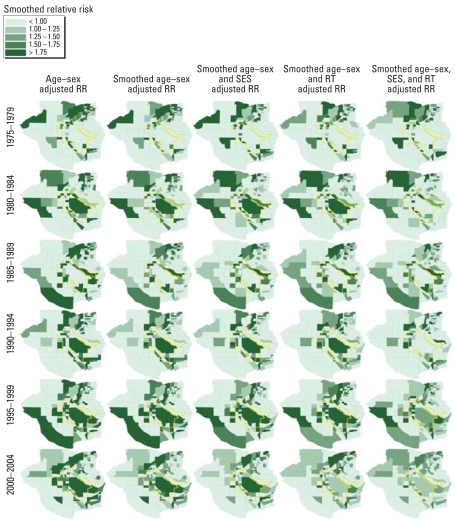
Methods: For this study, we used cancer data from the Utah Cancer Registry for cancers of the lung, kidney, and non-Hodgkin lymphoma. We used SIR and the RIF to investigate the cancer rate in a defined population within the study area during six consecutive 5-year time intervals (1975-2004). We used SaTScan and the RIF to explore the study area for clusters.
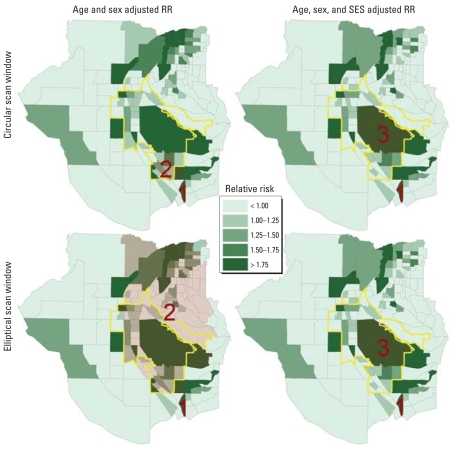
Results: The RIF risk analysis and SIR are mathematically identical. SIR is set up and computed by programming SAS; the RIF risk analysis, on the other hand, is set up through four menu-driven steps. The RIF disease-mapping feature enhanced the interpretation of SaTScan results. We found kidney and lung cancer to be statistically elevated for the potentially exposed population for one and two periods, respectively. SaTScan found two clusters, one outside the potentially exposed population and one that included a portion of that population.
Conclusion: The RIF is an easy-to-use and useful tool that extends the ability of the investigator to conduct analysis of disease rates and interpret the findings.
Keywords: cancer; exposure assessment; risk assessment; statistics.
Figures
References
-
- ATSDR. Toxicological Profile for Carbon Tetrachloride. Atlanta, GA: Agency for Toxic Substances and Disease Registry; 1994. - PubMed
-
- ATSDR. Toxicological Profile for Tetrachloroethylene (Update) Atlanta, GA: Agency for Toxic Substances and Disease Registry; 1997a. - PubMed
-
- ATSDR. Toxicological Profile for Trichloroethylene (Update) Atlanta, GA: Agency for Toxic Substances and Disease Registry; 1997b. - PubMed
-
- ATSDR. Public Health Assessment: Hill Air Force Base, Davis and Weber Counties, Utah. Atlanta, GA: Agency for Toxic Substances and Disease Registry; 2003.
-
- da Silva S, Melo L, Ehlers R. Spatial Analysis of Incidence Rates: A Bayesian Approach. Universidade Federal do Parana; Brazil: 2006. [[accessed 31 December 2007]]. Available: http://www.est.ufpr.br/rt/ehl04.pdf.
Publication types
MeSH terms
Grants and funding
LinkOut - more resources
Full Text Sources
Medical