

Estimating community drug abuse by wastewater analysis
- PMID: 18709161
- PMCID: PMC2516581
- DOI: 10.1289/ehp.11022
Estimating community drug abuse by wastewater analysis
Abstract
Background: The social and medical problems of drug abuse are a matter of increasing global concern. To tackle drug abuse in changing scenarios, international drug agencies need fresh methods to monitor trends and patterns of illicit drug consumption.
Objective: We tested a sewage epidemiology approach, using levels of excreted drug residues in wastewater, to monitor collective use of the major drugs of abuse in near real time.
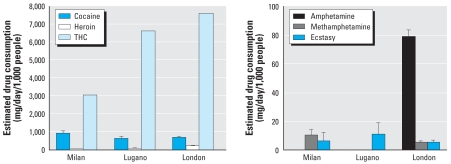
Methods: Selected drug target residues derived from use of cocaine, opiates, cannabis, and amphetamines were measured by mass spectrometry in wastewater collected at major sewage treatment plants in Milan (Italy), Lugano (Switzerland), and London (United Kingdom). The amounts of drug residues conveyed to the treatment plants, reflecting the amounts collectively excreted with urine, were used to estimate consumption of the active parent drugs.
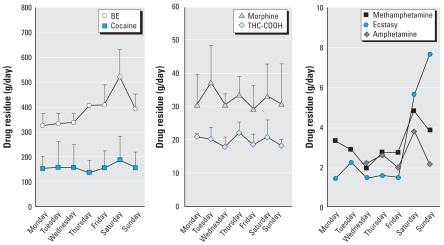
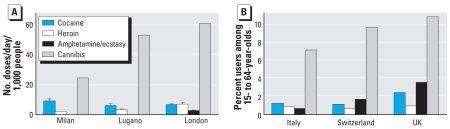
Results: Reproducible and characteristic profiles of illicit drug use were obtained in the three cities, thus for the first time quickly revealing changes in local consumption (e.g., cocaine consumption rose significantly on weekends in Milan). Profiles of local drug consumption based on waste-water measurements are in line with national annual prevalence estimates.
Conclusions: Patterns and trends of drug abuse in local communities can be promptly monitored by this tool, a convenient new complement to more complex, lengthy survey methods. In principle, searching the sewage for excreted compounds relevant to public health issues appears to have the potential to become a convenient source of real-time epidemiologic information.
Keywords: amphetamines; cannabis; cocaine; drug residues; illicit drugs; mass spectrometry; opiates; sewage epidemiology; urinary metabolites.
Figures
References
-
- Baselt RC. Disposition of Toxic Drugs and Chemicals in Man. 3. Foster City, CA: Biomedical Publications; 2004.
-
- Bohannon J. Hard data on hard drugs, grabbed from the environment. Science. 2007;316:42–44. - PubMed
-
- Bones J, Thomas KV, Paull B. Using environmental analytical data to estimate levels of community consumption of illicit drugs and abused pharmaceuticals. J Environ Monit. 2007;9:701–707. - PubMed
-
- Castiglioni S, Zuccato E, Chiabrando C, Fanelli R, Bagnati R. Mass spectrometric analysis of illicit drugs in waste-water and surface water. Mass Spectrom Rev. 2008;27:378–394. - PubMed
-
- Castiglioni S, Zuccato E, Crisci E, Chiabrando C, Fanelli R, Bagnati R. Identification and measurement of illicit drugs and their metabolites in urban wastewater by liquid chromatography–tandem mass spectrometry. Anal Chem. 2006;78:8421–8429. - PubMed
MeSH terms
Substances
LinkOut - more resources
Full Text Sources
Medical
