Comparative Study
. 2008;9(8):R130.
doi: 10.1186/gb-2008-9-8-r130. Epub 2008 Aug 18.

Global transcriptome analysis reveals circadian regulation of key pathways in plant growth and development

Affiliations
Comparative Study

Global transcriptome analysis reveals circadian regulation of key pathways in plant growth and development

Michael F Covington et al. Genome Biol. 2008.

Abstract

Background: As nonmotile organisms, plants must rapidly adapt to ever-changing environmental conditions, including those caused by daily light/dark cycles. One important mechanism for anticipating and preparing for such predictable changes is the circadian clock. Nearly all organisms have circadian oscillators that, when they are in phase with the Earth's rotation, provide a competitive advantage. In order to understand how circadian clocks benefit plants, it is necessary to identify the pathways and processes that are clock controlled.

Results: We have integrated information from multiple circadian microarray experiments performed on Arabidopsis thaliana in order to better estimate the fraction of the plant transcriptome that is circadian regulated. Analyzing the promoters of clock-controlled genes, we identified circadian clock regulatory elements correlated with phase-specific transcript accumulation. We have also identified several physiological pathways enriched for clock-regulated changes in transcript abundance, suggesting they may be modulated by the circadian clock.

Conclusion: Our analysis suggests that transcript abundance of roughly one-third of expressed A. thaliana genes is circadian regulated. We found four promoter elements, enriched in the promoters of genes with four discrete phases, which may contribute to the time-of-day specific changes in the transcript abundance of these genes. Clock-regulated genes are over-represented among all of the classical plant hormone and multiple stress response pathways, suggesting that all of these pathways are influenced by the circadian clock. Further exploration of the links between the clock and these pathways will lead to a better understanding of how the circadian clock affects plant growth and leads to improved fitness.


Figures
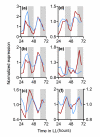
Figure 1
Figure 1
Validation of circadian microarray data by RT-PCR. Expression data from two independent time courses (blue = microarray; red = RT-PCR) for randomly chosen (a-c) high amplitude (At1g06460, At1g69830, and At5g12110) and (e-f) low amplitude (At3g22970, At1g45688, and At3g04760) circadian-regulated genes. Amplitude classification is based on microarray analysis [7]. For panel f, RT-PCR and microarray data are plotted on the left and right y-axes, respectively. White and gray shading represent subjective day and night, respectively.
Figure 2
Figure 2
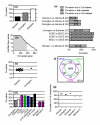
Comparison of three circadian microarray datasets. The power to detect circadian genes is greatly increased when independent datasets are combined. (a) The degree of circadian regulation of the Arabidopsis genome as originally reported in different studies [4,6,7]. (b) The number of unique unreplicated time series (generated by random shuffling of Harmer technical replicates) that identifies each of the circadian-regulated genes found in at least one shuffled time series. The shaded portion indicates the genes that are found to be circadian in a majority of the time series. (c) The shuffled Harmer datasets were analyzed according to the parameters originally used for the Covington dataset; only genes common to the two microarray platforms were considered. (d) The Covington dataset was reanalyzed according to the parameters originally used for the Edwards dataset, with the exception that only genes expressed in both datasets were evaluated. Also shown are the results of the analysis of the combined Covington and Edwards datasets, as well as the Michael datasets. For the individual and combined Covington plus Edwards datasets, only genes that are expressed in both of the individual data sets are considered. (e) The unions and intersections of sets of genes determined to be circadian expressed by the different datasets. Harmer-A and Harmer-B represent the two of the 20 shuffled datasets with the degree of circadian regulation closest to the 50th percentile. The percent overlap for each pair is shown in parentheses. (f) There is substantial overlap in the identity of circadian regulated genes (shown as numbers within Venn diagram circles) found by the three combined Covington plus Edwards datasets. The number in the lower right represents the number of genes that are expressed in both the Covington and Edwards datasets. (g) Collections of circadian genes identified in different datasets share substantial identity with the circadian genes found by each of the three combined Covington and Edwards datasets.
Figure 3
Figure 3
Identification of local clusters of circadian-regulated genes. Genome location (x-axis) and mean circadian phase (y-axis) are shown for clusters of circadian-regulated genes. Eighteen clusters were identified based on the proportion of circadian-regulated genes (red diamonds), the mean pMMC-β value (blue circles), or the mean combinatorial pair-wise Pearson correlation coefficient (black squares) in a sliding window of 2, 5, or 10 genes. The number of circadian-regulated genes within each cluster (ranging from one to six genes) is represented by the size of the corresponding symbol. The individual chromosomes are indicated by shading and numbers.
Figure 4
Figure 4
Analysis and identification of regulatory elements in the promoters of circadian-expressed genes. (a) Frequency of the evening element (EE) and CCA1-binding site (CBS) motifs in the promoters of circadian-regulated genes classified by phase of peak expression. Asterisks indicate phases during which the frequency of promoters containing the motif is significantly different from that of all circadian promoters. Asterisks are placed above the data point to indicate over-representation of the motif and below to indicate under-representation. Both the EE and the CBS are under-represented in promoters of genes with peak expression at circadian time 16. The horizontal lines indicate frequency of the motifs (solid line = EE; dashed line = CBS) in the promoters of all circadian-regulated genes. (b) Tree of putative circadian clock regulatory elements (CCREs) clustered based on sequence similarity is plotted adjacent to a heat map that represents the frequency of each motif in phase-specific subsets of the promoters of genes determined to be circadian regulated in the original analyses of the Covington (left half of heat map) and Edwards (right half of heat map) datasets [6,7]. In the heat map, dark and light shading represent high and low frequency, respectively. (c-f) Consensus sequences depicted as sequence logos are shown for select clades. (g-j) The phase-specific frequencies of the consensus sequences are plotted in a similar manner as in panel a, except that frequency data are shown for both the Covington (first 24 hours) and Edwards (second 24 hours) datasets and is normalized to the frequency of the sequence in the promoters of all circadian genes. The mean phase-specific frequencies for all the motifs in a clade are shown as dashed lines. For panels a and g to j, white and gray shading represent subjective day and night, respectively.
Figure 5
Figure 5
Circadian co-regulation of metabolic pathways. (a) Metabolic pathways for the production of the key intermediate geranylgeranyl diphosphate (GGDP), carotenoids, tocopherols, and the phytohormone abscisic acid (ABA). The three rate-limiting enzymes CLA1 (At4g15560), PSY (At5g17230), and NCED3 (At3g14440) are indicated next to the corresponding arrows. The pathways are color-coded to match the circadian expression profiles for genes involved in the synthesis of (b) GGDP, (c) tocopherols, (d) carotenoids, and (e) ABA. Large colored arrows in panel a represent steps carried out by enzymes encoded by circadian-regulated genes (shown as thick lines in panels b to e). Medium-sized colored arrows in panel a represent a gene determined to be rhythmically expressed based on visual inspection, but that does not pass the stringent cut-off for being considered circadian regulated (pMMC-β < 0.05; shown as thin line in panel d). Thin black arrows shown in panel a represent genes that do not appear to be circadian regulated. Dashed arrows in panel a and dashed data series in panels b to d represent circadian genes that do not match the consolidated phase of expression of the other circadian genes in the pathways. The dashed data series in panel d corresponds to NPQ1 (At1g08550), which is the gene responsible for the conversion of violaxanthin back to zeaxanthin (shown as dashed arrow in panel a). The dashed line in panel b corresponds to IPP1 (At5g16440) and that in panel c corresponds to VTE2 (At2g18950). Panel e shows the mean circadian expression profiles of genes that are both circadian regulated and ABA induced (black; n = 492) and circadian-regulated ABA biosynthetic genes (green). The data shown in panels b to e are from the combined Covington plus Edwards dataset CCEE. Expression levels are plotted on the y-axes and time in constant light is plotted on the x-axes. For panels b to e, white and gray shading represent subjective day and night, respectively.
Figure 6
Figure 6
Hormone-responsive genes are circadian regulated. The proportions of clock-regulated genes among all that are upregulated or downregulated by each phytohormone are plotted as columns. Asterisks indicate statistically significant circadian enrichment (P < 0.05). The overlaid polar plots show the average circadian phases of expression for the hormone-responsive genes. The white and shaded portions of each polar plot represent subjective day and night, respectively, with subjective dawn at the left and subjective dusk at the right. The longer the arrow, the greater the degree of phase consolidation for each group of circadian-regulated genes.
Figure 7
Figure 7
Co-expression of hormone-induced genes with signaling genes. Circadian phase distributions of 1-aminocyclopropane-1-carboxylic acid (ACC)- induced (red, above x-axis) and ACC-repressed (blue, below x-axis) genes are shown as histograms quadruple plotted on the left y-axes. Time series data are shown for EIN3 (At3g20770) and EIL1 (At2g27050), circadian-regulated genes involved in ACC signalling (black). Expression levels from the combined Covington plus Edwards dataset CCEE are plotted on the right y-axis and time in constant light is plotted on the x-axis. White and gray shading represent subjective day and night, respectively.
Figure 8
Figure 8
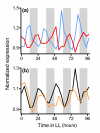
Stress-responsive genes are circadian regulated. (a) Circadian-regulated heat-induced genes are expressed before subjective dawn, completely out of phase with cold-induced genes. The average expression profile of heat-induced genes is indicated in red (n = 30), whereas that of cold-induced genes is indicated in blue (n = 46). (b) Circadian-regulated genes responsive to the reactive oxygen species hydrogen peroxide or to oxidative damage are expressed during the early subjective day. The average expression profile of genes induced by these compounds is shown in black (n = 41); for comparison, the average expression profile of genes involved in the light-harvesting reactions of photosynthesis is shown in orange (n = 60). The data shown are from the combined Covington plus Edwards data set CCEE. Mean expression levels are plotted on the y-axes and time in constant light is plotted on the x-axes. White and gray shading represent subjective day and night, respectively.

References

    1. Gardner MJ, Hubbard KE, Hotta CT, Dodd AN, Webb AA. How plants tell the time. Biochemical J. 2006;397:15–24. - PMC - PubMed
    1. Dodd AN, Salathia N, Hall A, Kevei E, Toth R, Nagy F, Hibberd JM, Millar AJ, Webb AA. Plant circadian clocks increase photosynthesis, growth, survival, and competitive advantage. Science. 2005;309:630–633. - PubMed
    1. Woelfle MA, Ouyang Y, Phanvijhitsiri K, Johnson CH. The adaptive value of circadian clocks: an experimental assessment in cyanobacteria. Curr Biol. 2004;14:1481–1486. - PubMed
    1. Harmer SL, Hogenesch JB, Straume M, Chang HS, Han B, Zhu T, Wang X, Kreps JA, Kay SA. Orchestrated transcription of key pathways in Arabidopsis by the circadian clock. Science. 2000;290:2110–2113. - PubMed
    1. Schaffer R, Landgraf J, Accerbi M, Simon V, Larson M, Wisman E. Microarray analysis of diurnal and circadian-regulated genes in Arabidopsis. Plant Cell. 2001;13:113–123. - PMC - PubMed

Publication types

MeSH terms