. 2008 Aug 25;182(4):753-63.
doi: 10.1083/jcb.200801062. Epub 2008 Aug 18.

Mechanotransduction in an extracted cell model: Fyn drives stretch- and flow-elicited PECAM-1 phosphorylation

Affiliations

Mechanotransduction in an extracted cell model: Fyn drives stretch- and flow-elicited PECAM-1 phosphorylation

Yi-Jen Chiu et al. J Cell Biol. .

Abstract

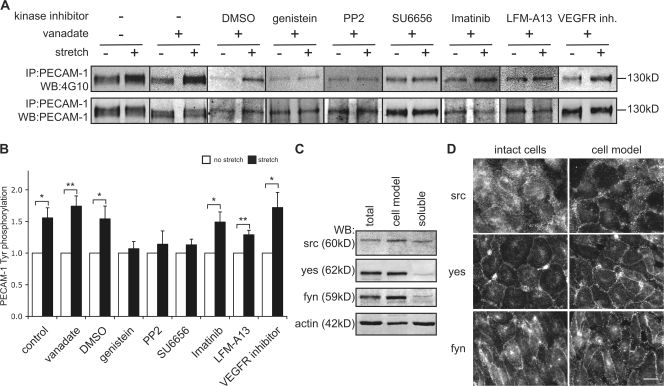
Mechanosensing followed by mechanoresponses by cells is well established, but the mechanisms by which mechanical force is converted into biochemical events are poorly understood. Vascular endothelial cells (ECs) exhibit flow- and stretch-dependent responses and are widely used as a model for studying mechanotransduction in mammalian cells. Platelet EC adhesion molecule 1 (PECAM-1) is tyrosine phosphorylated when ECs are exposed to flow or when PECAM-1 is directly pulled, suggesting that it is a mechanochemical converter. We show that PECAM-1 phosphorylation occurs when detergent-extracted EC monolayers are stretched, indicating that this phosphorylation is mechanically triggered and does not require the intact plasma membrane and soluble cytoplasmic components. Using kinase inhibitors and small interfering RNAs, we identify Fyn as the PECAM-1 kinase associated with the model. We further show that stretch- and flow-induced PECAM-1 phosphorylation in intact ECs is abolished when Fyn expression is down-regulated. We suggest that PECAM-1 and Fyn are essential components of a PECAM-1-based mechanosensory complex in ECs.


Figures

Figure 1.
Figure 1.
Stretch-induced PECAM-1 phosphorylation in intact ECs. (A) Confluent BAECs cultured on an elastic substrate were stretched (25% elongation) for 5 min or left unstretched and stained with anti–protein phosphotyrosine (4G10). Tyrosine phosphorylated proteins were associated with interendothelial contacts, but this localization pattern became more prominent in stretched cells. Bipolar arrow indicates the direction of stretch. Bar, 20 μm. (B) Confluent or sparse BAECs cultured on an elastic substrate were subjected to stretch (25% elongation) for the times indicated or left unstretched. PECAM-1 phosphorylation was analyzed by immunoprecipitating PECAM-1 and immunoblotting with anti–PECAM-1 and 4G10. Although PECAM-1 phosphorylation increased in confluent cells, no increase was observed in sparse cultures. Black lines indicate that intervening lanes have been spliced out. (C) Quantification of immunoblotting results. Relative levels of PECAM-1 phosphorylation were determined by measuring the intensity of immunoblotted bands (see Materials and methods) and expressed relative to the phospho–PECAM-1 level in unstretched cells (mean ± SEM). Sample size: n = 6 for confluent samples, n = 3 for sparse samples. Student's t test was used to compare each time point with unstretched sample for each category. *, P = 0.0007, 0.0006, and 0.0003 for 5, 10, and 15 min, respectively. #, P = 0.0733 (confluent, stretched 2 min) and 0.5077 (sparse, stretched 10 min).
Figure 2.
Figure 2.
The detergent-extracted EC model. (A) Schematic representation of the preparation and mechanical activation of the cell model. Confluent BAECs cultured on an elastic substrate were extracted briefly with Triton X-100. The material remaining attached was considered “the extracted cell model”. The model was subsequently incubated with buffer containing ATP and subjected to uniaxial stretch or left unstretched at 37°C. (B) Scanning electron micrographs showing the surface structure of intact cells and extracted cell models. Note that intracellular structures are exposed in extracted cells (right), whereas smooth plasma membrane is seen in intact ECs (left). Bars: (top) 10 μm; (bottom) 1 μm. (C) Immunofluorescence localization of PECAM-1 in intact and extracted BAECs. Cell border localization of PECAM-1 is preserved in the model. Bar, 10 μm.
Figure 3.
Figure 3.
Increased tyrosine phosphorylation in the stretched cell model. (A) Extracted BAEC models were stretched or unstretched for 10 min and double labeled with 4G10 and anti–pan-cadherin. Note that cells in the stretched monolayer are more clearly outlined by 4G10 staining than those in the unstretched sample. No significant changes were observed in anti-cadherin staining before and after stretching. Bipolar arrow indicates the direction of stretch. Bar, 20 μm. (B) BAECs cultured on an elastic substrate were treated with Lipofectamine only (LF control) or transiently transfected with PECAM-1 siRNA and then extracted. The extracted models were stretched or left unstretched for 5 min at 37°C and their tyrosine phosphorylated protein levels determined using 4G10 immunoblotting. Arrow indicates a 130-kD band whose phosphorylation level was diminished in PECAM-1 siRNA transfected cells.
Figure 4.
Figure 4.
Stretch-induced PECAM-1 phosphorylation in the cell model. (A) BAEC models were stretched or left unstretched for 5 min in the presence or absence of ATP. PECAM-1 was immunoprecipitated from solubilized models and immunoblotted with 4G10 and anti–PECAM-1. An example of typical immunoblotting data is shown (left). Intensity of immunoblotted bands was quantified and expressed relative to the PECAM-1 phosphorylation level in ATP-treated unstretched samples (right; mean ± SEM; n = 4). Student's t test was used to compare stretched to unstretched samples for each category. *, P = 0.0003; #, P = 0.1248. (B) BAEC models were stretched for 5 min to various extents (% elongation) and immunoprecipitated PECAM-1 was immunoblotted with 4G10 and anti–PECAM-1. Levels of phosphorylation were quantified and expressed relative to the PECAM-1 phosphorylation level in unstretched cells (mean ± SEM). Sample size: n = 3 for 0, 5, 15, and 25%; n = 2 for 10 and 20%. Student's t test was used to compare stretched to unstretched samples. *, P = 0.0095, 0.0095, and 0.0049 for 5, 15, and 25%, respectively. (C) Cyclic stretch (15%; 1 Hz; 5 min) induced a 1.53 ± 0.05-fold increase (mean ± SEM; n = 3) of PECAM-1 phosphorylation in extracted BAEC models. Control chambers were left on the movable shaft of the stretch apparatus without stretching so that they were exposed to the same oscillation (motion control). Student's t test was used to compare stretched to unstretched samples. P = 0.0002. (D) Stretch-induced PECAM-1 phosphorylation in intact and extracted HUVEC. Student's t test was used to compare stretched to unstretched samples. In intact cells, stretch induced a 1.42 ± 0.18-fold increase (mean ± SEM; n = 5; P = 0.0273). In extracted models, stretch induced a 1.75 ± 0.33-fold increase (mean ± SEM; n = 5; P = 0.0260). Black lines indicate that intervening lanes have been spliced out.
Figure 5.
Figure 5.
Kinase inhibitor screening. (A) BAEC models were pretreated with inhibitors for 1 min at 37°C and stretched (25% elongation) or left unstretched for 5 min in the presence of inhibitors, Na3VO4, and ATP. PECAM-1 was immunoprecipitated from solubilized models and immunoblotted with anti–PECAM-1 and 4G10. Note that some inhibitors inhibited PECAM-1 phosphorylation, whereas others did not. Control models were treated with no inhibitor and either Na3VO4 or DMSO and Na3VO4. Black lines indicate that intervening lanes have been spliced out. (B) Quantification of inhibitor effects on PECAM-1 phosphorylation. Levels of PECAM-1 phosphorylation relative to unstretched models are shown (mean ± SEM; n = 3). Student's t test was used to compare stretched to unstretched samples for each inhibitor. P = 0.0153 (control), 0.0050 (Na3VO4), 0.0117 (DMSO), 0.2800 (genistein), 0.2622 (PP2), 0.0958 (SU6656), 0.0158 (Imatinib), 0.0085 (LFM-A13), and 0.0202 (VEGFR inhibitor). *, P < 0.05; **, P < 0.01. (C) BAEC whole cell lysates (total), cell models, and detergent-soluble fractions (soluble) were immunoblotted with anti-Src, anti-Yes, or anti-Fyn. Comparable amounts of total protein were loaded in each lane as shown by immunoblots for actin. (D) Src, Fyn, and Yes were localized to interendothelial contacts in both intact cells and cell models. HAECs were used for Src localization, whereas BAECs were used for Yes and Fyn localization. Bar, 20 μm.
Figure 6.
Figure 6.
Fyn is essential for the PECAM-1 mechanoresponse in cell models. (A) Controls for siRNA experiments. ECs cultured on an elastic substrate were transiently transfected with Lipofectamine 2000 alone, negative control siRNA, or scrambled siRNAs, stretched in the presence of Na3VO4 for 10 min, and PECAM-1 tyrosine phosphorylation was assayed (top). Compared with unstretched ECs under each condition, stretched cells exhibited increased PECAM-1 phosphorylation by 1.42 ± 0.08- (LF only; n = 6), 1.84 ± 0.15- (control siRNA; n = 4), 1.69 ± 0.17- (scrambled siRNA-2; n = 3), and 1.49 ± 0.09- (scrambled siRNA-1; n = 3) fold (mean ± SEM). Student's t test was used to compare stretched to unstretched values. *, P = 0.0002 (LF control), 0.001 (control siRNA), 0.047 (scrambled siRNA-2), and 0.004 (scrambled siRNA-1). The bottom shows the expression of PECAM-1, Src, Yes, and Fyn in whole cell lysates by immunoblotting using actin as a loading control. Although not depicted here, Fer expression was not altered by these control siRNAs. (B–F) ECs cultured on an elastic substrate were transiently transfected with Src, Yes, or Fyn siRNA or Lipofectamine 2000 alone, and cell models were made after they formed confluent monolayers. Models were stretched or left unstretched for 5 min at 37°C in the presence of ATP and Na3VO4, and PECAM-1 phosphorylation was assayed. Each kinase associated with the cell model was checked by immunoblotting, using the level of actin as a loading control. (B and C) PECAM-1 phosphorylation was not suppressed in HAEC models with reduced Src expression. PECAM-1 phosphorylation levels are shown relative to unstretched models (mean ± SEM; n = 3). Student's t test was used to compare stretched to unstretched values. *, P = 0.0124 (LF control) and 0.0292 (Src siRNA). (D) PECAM-1 phosphorylation was not suppressed in BAEC models with reduced Yes expression. (E) Suppressed PECAM-1 phosphorylation in BAEC models with reduced Fyn expression is shown. (F) Levels of PECAM-1 phosphorylation in Yes and Fyn siRNA experiments are quantified and shown relative to unstretched models (mean ± SEM; n = 5). Student's t test was used to compare stretched to unstretched values. *, P = 1.7 ×10⁻⁷ (LF control) and 0.0032 (Yes siRNA); #, P = 0.1665. Black lines indicate that intervening lanes have been spliced out.
Figure 7.
Figure 7.
Fyn mediates stretch- and flow-elicited PECAM-1 phosphorylation in ECs. ECs cultured on an elastic substrate were transiently transfected with Src, Yes, or Fyn siRNA or Lipofectamine 2000 alone. When confluent monolayers were formed, cells were stretched in the presence of Na3VO4 for 10 min and PECAM-1 tyrosine phosphorylation was assayed. Expression of each kinase was checked in whole cell lysates by immunoblotting using actin as a loading control. (A) PECAM-1 phosphorylation was not suppressed in HAECs transfected with Src siRNA. (B) Levels of PECAM-1 phosphorylation in Src siRNA-treated HAECs are quantified and shown relative to unstretched cells (mean ± SEM; n = 4). Student's t test was used to compare stretched to unstretched values. *, P = 0.0315 (LF control) and 0.0264 (Src siRNA). (C) Reduced expression of Yes in BAECs did not suppress PECAM-1 phosphorylation. (D) PECAM-1 phosphorylation was suppressed in BAECs transfected with two different Fyn siRNAs. (E) Levels of PECAM-1 phosphorylation in Yes and Fyn siRNAs treated cells are quantified and shown relative to unstretched cells (mean ± SEM). The sample sizes are n = 4 for Lipofectamine control and Yes siRNA, n = 3 for Fyn siRNA-2, and n = 5 for Fyn siRNA-1. Student's t test was used to compare stretched to unstretched values for each category. *, P = 0.0002 (Lipofectamine control) and 9.8 × 10⁻⁷ (Yes siRNA). #, P = 0.1493 (Fyn siRNA-2) and 0.4875 (Fyn siRNA-1). (F) Confluent BAECs transiently transfected with Fyn siRNA or Lipofectamine 2000 alone were subjected to flow (24 dyn/cm2) in the presence of Na3VO4 for 10 min at 37°C, and PECAM-1 phosphorylation was assayed. Flow-induced PECAM-1 phosphorylation was suppressed in Fyn siRNA-treated cells. (G) Quantified results of flow experiments were expressed as the mean ± SEM (n = 4). Student's t test was used to compare shear stressed to static control values. *, P = 0.0311; #, P = 0.0532. (H) Fyn activity was analyzed in BAECs subjected to stretch or flow for 10 min by immunoprecipitation with anti-Fyn and immunoblot with antibodies that recognize the active form of Src family kinases (pY418 SFK). Note that mechanical stress does not increase Fyn activity. Note also that Fyn is active in unstimulated (unstretched and static) cells. One of three independent experimental results is depicted. Black lines indicate that intervening lanes have been spliced out.

References

    1. Akiyama, T., and H. Ogawara. 1991. Use and specificity of genistein as inhibitor of protein-tyrosine kinases. Methods Enzymol. 201:362–370. - PubMed
    1. Bagi, Z., J.A. Frangos, J.C. Yeh, C.R. White, G. Kaley, and A. Koller. 2005. PECAM-1 mediates NO-dependent dilation of arterioles to high temporal gradients of shear stress. Arterioscler. Thromb. Vasc. Biol. 25:1590–1595. - PubMed
    1. Blake, R.A., M.A. Broome, X. Liu, J. Wu, M. Gishizky, L. Sun, and S.A. Courtneidge. 2000. SU6656, a selective src family kinase inhibitor, used to probe growth factor signaling. Mol. Cell. Biol. 20:9018–9027. - PMC - PubMed
    1. Cao, M.Y., M. Huber, N. Beauchemin, J. Famiglietti, S.M. Albelda, and A. Veillette. 1998. Regulation of mouse PECAM-1 tyrosine phosphorylation by the Src and Csk families of protein-tyrosine kinases. J. Biol. Chem. 273:15765–15772. - PubMed
    1. Chau, C.H., K.Y. Chen, H.T. Deng, K.J. Kim, K. Hosoya, T. Terasaki, H.M. Shih, and D.K. Ann. 2002. Coordinating Etk/Bmx activation and VEGF upregulation to promote cell survival and proliferation. Oncogene. 21:8817–8829. - PubMed

Publication types

MeSH terms