. 2008 Sep;248(3):844-51.
doi: 10.1148/radiol.2483071740.

Breast tumor xenografts: diffusion-weighted MR imaging to assess early therapy with novel apoptosis-inducing anti-DR5 antibody

Affiliations

Breast tumor xenografts: diffusion-weighted MR imaging to assess early therapy with novel apoptosis-inducing anti-DR5 antibody

Hyunki Kim et al. Radiology. 2008 Sep.

Abstract

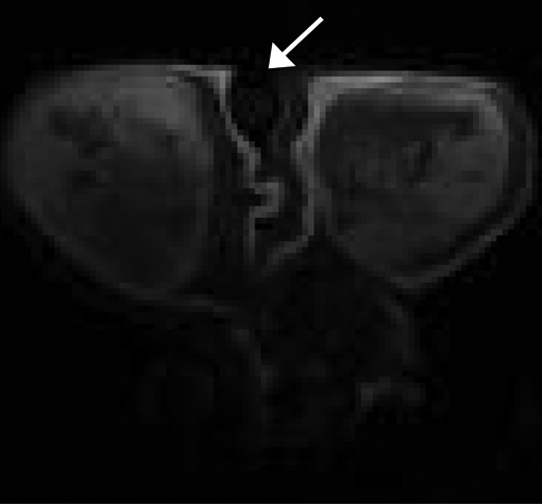
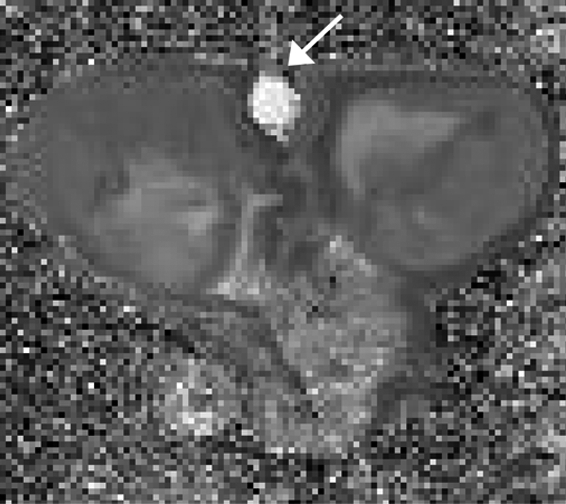
Purpose: To measure the early therapeutic response to a novel apoptosis-inducing antibody, TRA-8, by using diffusion-weighted magnetic resonance (MR) imaging in a mouse breast cancer model.

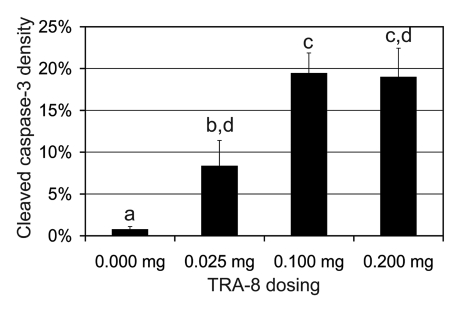
Materials and methods: Animal experiments had institutional animal care and use committee approval. Four groups of nude mice bearing luciferase-positive breast tumors (four to five mice with eight to 10 tumors per group) were injected intravenously with 0 mg (group 1), 0.025 mg (group 2), 0.100 mg (group 3), or 0.200 mg (group 4) of TRA-8 on days 0 and 3. Diffusion-weighted imaging, anatomic MR imaging, and bioluminescence imaging were performed on days 0, 3, and 6 before dosing. Averaged apparent diffusion coefficients (ADCs) for both whole tumor volume and a 1-mm peripheral tumor shell were calculated and were compared with tumor volume and living tumor cell changes. After imaging at day 6, proliferating and apoptotic cell densities were measured with Ki67 and terminal deoxynucleotidyl transferase mediated dUTP nick end labeling, or TUNEL, staining, respectively, and were compared with cleaved caspase-3 density.

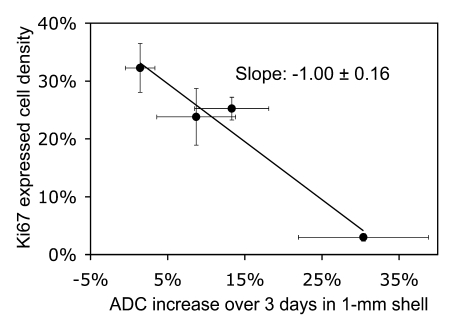
Results: The ADC increase at day 3 was dependent on TRA-8 dose level, averaging 6% +/- 3 (standard error of mean), 19% +/- 4, 14% +/- 4, and 34% +/- 7 in the whole tumor volume and 1% +/- 2, 9% +/- 5, 13% +/- 5, and 30% +/- 8 in the outer 1-mm tumor shell only for groups 1, 2, 3, and 4, respectively. The ADC increase in group 4 was significantly higher (P = .0008 and P = .0189 for whole tumor volume and peripheral region, respectively) than that in group 1 on day 3, whereas tumor size did not significantly differ. At day 3, the dose-dependent ADC increases were linearly proportional to apoptotic cell and cleaved caspase-3 densities and were inversely proportional to the density of cells showing Ki67 expression.

Conclusion: Diffusion-weighted imaging enabled measurement of early breast tumor response to TRA-8 treatment, prior to detectable tumor shrinkage, providing an effective mechanism to noninvasively monitor TRA-8 efficacy.

Supplemental material: http://radiology.rsnajnls.org/cgi/content/full/248/3/844/DC1.


Figures

Figure 1a:
Figure 1a:
Representative diffusion-weighted images in mouse bearing subcutaneous 2LMP tumor obtained prior to initial therapy with two diffusion-weighting factors: (a) a b factor of 5 sec/mm2 and (b) a b factor of 1000 sec/mm2. (c) ADC map calculated from images a and b. A tube filled with pure water (arrow) was imaged as a standard for ADC quantification.
Figure 1b:
Figure 1b:
Representative diffusion-weighted images in mouse bearing subcutaneous 2LMP tumor obtained prior to initial therapy with two diffusion-weighting factors: (a) a b factor of 5 sec/mm2 and (b) a b factor of 1000 sec/mm2. (c) ADC map calculated from images a and b. A tube filled with pure water (arrow) was imaged as a standard for ADC quantification.
Figure 1c:
Figure 1c:
Representative diffusion-weighted images in mouse bearing subcutaneous 2LMP tumor obtained prior to initial therapy with two diffusion-weighting factors: (a) a b factor of 5 sec/mm2 and (b) a b factor of 1000 sec/mm2. (c) ADC map calculated from images a and b. A tube filled with pure water (arrow) was imaged as a standard for ADC quantification.
Figure 2a:
Figure 2a:
Intratumoral ADC change. (a) Representative ADC maps of tumoral regions at days 0, 3, and 6, obtained after mice were treated with 0, 0.025, 0.100, and 0.200 mg of TRA-8 (groups 1, 2, 3, and 4, respectively) on days 0 and 3. Scale (from 0 to 100) indicates signal intensity when maximum value is normalized to 100. Arrows = areas of low signal intensity induced by black-blood effect, excluded in calculating mean ADC value. (b) Mean ADC changes ± standard errors of mean in groups 1–4. * = P < .0167 (difference in ADC change between treated groups and control group after Bonferroni correction).
Figure 2b:
Figure 2b:
Intratumoral ADC change. (a) Representative ADC maps of tumoral regions at days 0, 3, and 6, obtained after mice were treated with 0, 0.025, 0.100, and 0.200 mg of TRA-8 (groups 1, 2, 3, and 4, respectively) on days 0 and 3. Scale (from 0 to 100) indicates signal intensity when maximum value is normalized to 100. Arrows = areas of low signal intensity induced by black-blood effect, excluded in calculating mean ADC value. (b) Mean ADC changes ± standard errors of mean in groups 1–4. * = P < .0167 (difference in ADC change between treated groups and control group after Bonferroni correction).
Figure 3a:
Figure 3a:
Histologic analysis of tumor response. (a) Representative TUNEL-stained (original magnification, ×250), Ki67-stained (original magnification, ×400), and cleaved caspase-3–stained (original magnification, ×400) slices of 2LMP tumors collected at day 6, after 0, 0.025, 0.100, and 0.200 mg of TRA-8 had been administered on days 0 and 3 in groups 1, 2, 3, and 4, respectively. Apoptotic cells and cells expressing Ki67 and cleaved caspase-3 are indicated with arrows in their respective slices. (b–d) Graphs show (b) apoptotic cell density, (c) proliferating (Ki67 expressing) cell density, and (d) cleaved caspase-3 density at the four dosing levels. Significant differences among groups after Bonferroni correction (P < .0167) are indicated by the difference of the letters above the bars. Error bars = standard errors of mean.
Figure 3b:
Figure 3b:
Histologic analysis of tumor response. (a) Representative TUNEL-stained (original magnification, ×250), Ki67-stained (original magnification, ×400), and cleaved caspase-3–stained (original magnification, ×400) slices of 2LMP tumors collected at day 6, after 0, 0.025, 0.100, and 0.200 mg of TRA-8 had been administered on days 0 and 3 in groups 1, 2, 3, and 4, respectively. Apoptotic cells and cells expressing Ki67 and cleaved caspase-3 are indicated with arrows in their respective slices. (b–d) Graphs show (b) apoptotic cell density, (c) proliferating (Ki67 expressing) cell density, and (d) cleaved caspase-3 density at the four dosing levels. Significant differences among groups after Bonferroni correction (P < .0167) are indicated by the difference of the letters above the bars. Error bars = standard errors of mean.
Figure 3c:
Figure 3c:
Histologic analysis of tumor response. (a) Representative TUNEL-stained (original magnification, ×250), Ki67-stained (original magnification, ×400), and cleaved caspase-3–stained (original magnification, ×400) slices of 2LMP tumors collected at day 6, after 0, 0.025, 0.100, and 0.200 mg of TRA-8 had been administered on days 0 and 3 in groups 1, 2, 3, and 4, respectively. Apoptotic cells and cells expressing Ki67 and cleaved caspase-3 are indicated with arrows in their respective slices. (b–d) Graphs show (b) apoptotic cell density, (c) proliferating (Ki67 expressing) cell density, and (d) cleaved caspase-3 density at the four dosing levels. Significant differences among groups after Bonferroni correction (P < .0167) are indicated by the difference of the letters above the bars. Error bars = standard errors of mean.
Figure 3d:
Figure 3d:
Histologic analysis of tumor response. (a) Representative TUNEL-stained (original magnification, ×250), Ki67-stained (original magnification, ×400), and cleaved caspase-3–stained (original magnification, ×400) slices of 2LMP tumors collected at day 6, after 0, 0.025, 0.100, and 0.200 mg of TRA-8 had been administered on days 0 and 3 in groups 1, 2, 3, and 4, respectively. Apoptotic cells and cells expressing Ki67 and cleaved caspase-3 are indicated with arrows in their respective slices. (b–d) Graphs show (b) apoptotic cell density, (c) proliferating (Ki67 expressing) cell density, and (d) cleaved caspase-3 density at the four dosing levels. Significant differences among groups after Bonferroni correction (P < .0167) are indicated by the difference of the letters above the bars. Error bars = standard errors of mean.
Figure 4a:
Figure 4a:
Comparison of histologic measures of tumor response with quantitative ADCs. Graphs show relationship between ADC increase over 3 days in a 1-mm shell from the outer tumor surface and (a) apoptotic cell density (data shown in Fig 3b) and (b) density of cells expressing Ki67 (data shown in Fig 3c) by using the linear regression method. Data points are means ± standard errors of mean.
Figure 4b:
Figure 4b:
Comparison of histologic measures of tumor response with quantitative ADCs. Graphs show relationship between ADC increase over 3 days in a 1-mm shell from the outer tumor surface and (a) apoptotic cell density (data shown in Fig 3b) and (b) density of cells expressing Ki67 (data shown in Fig 3c) by using the linear regression method. Data points are means ± standard errors of mean.

References

    1. Sheridan JP, Marsters SA, Pitti RM, et al. Control of TRAIL-induced apoptosis by a family of signaling and decoy receptors. Science 1997;277:818–821. - PubMed
    1. Walczak H, Miller RE, Ariail K, et al. Tumoricidal activity of tumor necrosis factor-related apoptosis-inducing ligand in vivo. Nat Med 1999;5:157–163. - PubMed
    1. Ashkenazi A, Pai RC, Fong S, et al. Safety and antitumor activity of recombinant soluble Apo2 ligand. J Clin Invest 1999;104:155–162. - PMC - PubMed
    1. Chinnaiyan AM, Prasad U, Shankar S, et al. Combined effect of tumor necrosis factor-related apoptosis-inducing ligand and ionizing radiation in breast cancer therapy. Proc Natl Acad Sci U S A 2000;97:1754–1759. - PMC - PubMed
    1. Jo M, Kim TH, Seol DW, et al. Apoptosis induced in normal human hepatocytes by tumor necrosis factor-related apoptosis-inducing ligand. Nat Med 2000;6:564–567. - PubMed

Publication types

MeSH terms

Substances