Review
. 2008 Aug;179(4):1741-56.
doi: 10.1534/genetics.108.094128.

Tilting at quixotic trait loci (QTL): an evolutionary perspective on genetic causation

Affiliations
Review

Tilting at quixotic trait loci (QTL): an evolutionary perspective on genetic causation

Kenneth M Weiss. Genetics. 2008 Aug.

Abstract

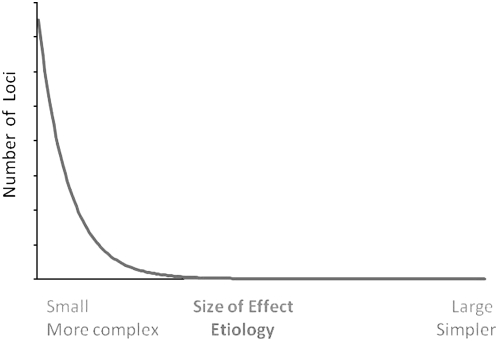
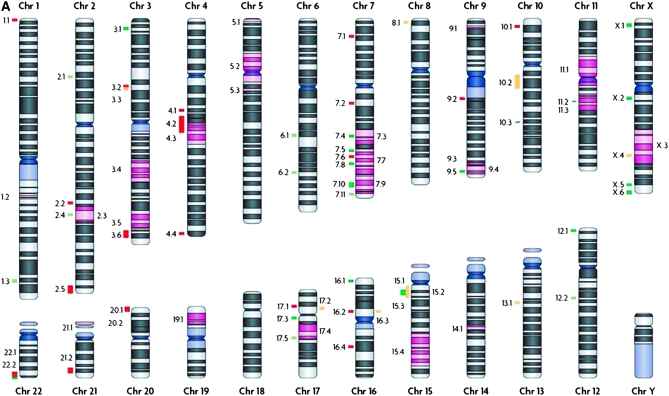
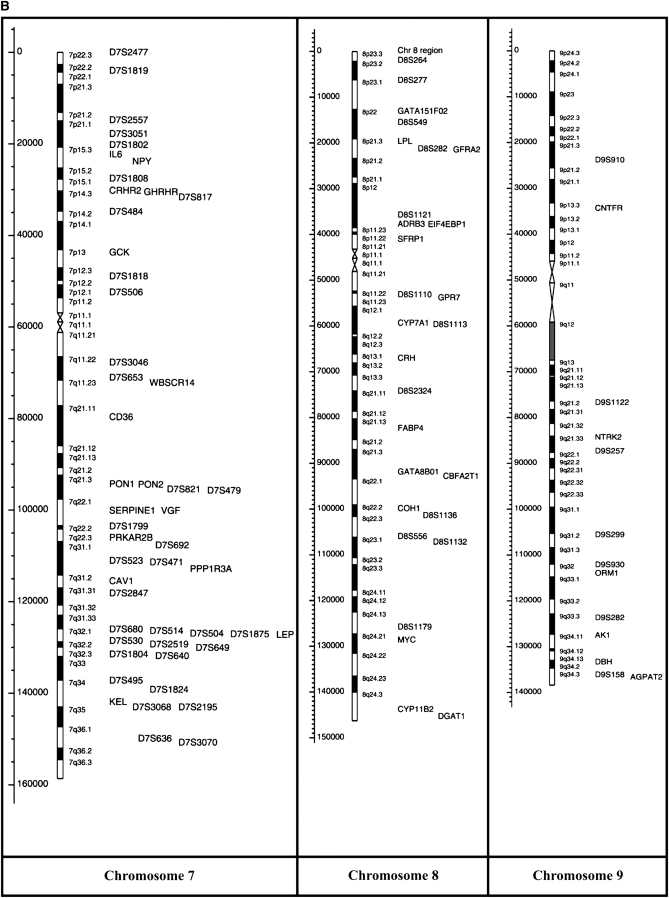
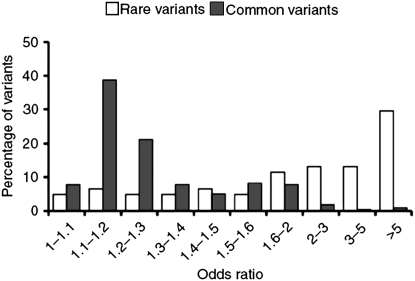
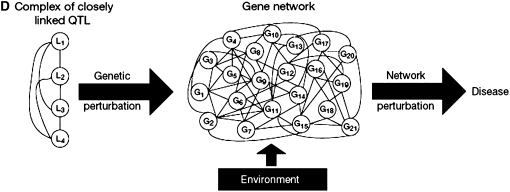
Recent years have seen great advances in generating and analyzing data to identify the genetic architecture of biological traits. Human disease has understandably received intense research focus, and the genes responsible for most Mendelian diseases have successfully been identified. However, the same advances have shown a consistent if less satisfying pattern, in which complex traits are affected by variation in large numbers of genes, most of which have individually minor or statistically elusive effects, leaving the bulk of genetic etiology unaccounted for. This pattern applies to diverse and unrelated traits, not just disease, in basically all species, and is consistent with evolutionary expectations, raising challenging questions about the best way to approach and understand biological complexity.


Figures

F<sc>igure</sc> 1.—
Figure 1.—
Schematic of the general relationship between number of contributing alleles or loci, their individual effect size, and the consequent degree of complexity of the resulting biological trait. Modified after Sing et al. (1996).
F<sc>igure</sc> 2.—
Figure 2.—
Heuristic examples of genomic mapping hits. The specifics are not important here. (A) A composite of studies of autism (Abrahams and Geschwind 2008). (B) A few human chromosomes showing obesity-associated hits mapped in mouse or human; the rest of the genome is similarly littered (Rankinen et al. 2006; http://obesitygene.pbrc.edu). (The figure is part of Figure 1 of Rankinen et al. 2006 and is adapted by permission from Macmillan Publishers, Ltd: Obesity. Rannekin et al. Copyright 2006.)
F<sc>igure</sc> 3.—
Figure 3.—
Typical odds ratios for rare (0.1–3% minor allele frequency, MAF) and common (>5% MAF) variants in genomewide association studies (from Bodmer and Bonilla 2008) (The figure is Figure 2 from Bodmer and Bonilla 2008 and is reprinted by permission from Macmillan Publishers, Ltd: Nature Genetics. Bodmer and Bonilla. Copyright 2008.)
F<sc>igure</sc> 4.—
Figure 4.—
Don Quixote, undaunted in assaulting elusive evil. Drawings are by Gustav Doré (1869), inspired by Don Quixote (Miguel Cervantes, 1605).
F<sc>igure</sc> 5.—
Figure 5.—
Complex trait architecture, then and now: early conceptual diagrams of interactive complexity of genes. (A) Wright's schematic indicator of combinations of genotypes that can affect phenotypes affected by just five pairs of alleles with potential differences among the interactions depending on which alleles are present (Wright 1931). (B) Waddington's metaphor of multiple genes tugging on various parts of a developmental landscape (Waddington 1957). (C) Elements of a genetic network of ∼200 diabetes-related genes correlating gene expression and human variation; red and green indicate, respectively, genes with positively or negatively correlated expression (courtesy of Joanne Curran, Southwest Foundation for Biomedical Research, unpublished research). (D) Hypothetical diabetes-related metabolic syndrome network suggested by mapping and experimental data in a cross between B6 and C3H laboratory mice, in which changes in one mapped location (left) affect a whole network of genes (center), ultimately modifying the final disease-related phenotype (right) (Chen et al. 2008). (D is Figure 4C from Chen et al. 2008 and is reprinted by permission from Macmillan Publishers, Ltd: Nature. Chen et al. Copyright 2008.)
F<sc>igure</sc> 6.—
Figure 6.—
Mississippi River drainage to New Orleans. (A) The major contributing rivers. (B) The entire drainage system (courtesy of R. K. Weiss, ESRI Geographic Information Systems).
F<sc>igure</sc> 6.—
Figure 6.—
Mississippi River drainage to New Orleans. (A) The major contributing rivers. (B) The entire drainage system (courtesy of R. K. Weiss, ESRI Geographic Information Systems).

References

    1. Abrahams, B. S., and D. H. Geschwind, 2008. Advances in autism genetics: on the threshold of a new neurobiology. Nat. Rev. Genet. 9 341–355. - PMC - PubMed
    1. Allen, N. C., S. Bagade, M. B. McQueen, J. P. Ioannidis, F. K. Kavvoura et al., 2008. Systematic meta-analyses and field synopsis of genetic association studies in schizophrenia: the SzGene database. Nat. Genet. 40 827–834. - PubMed
    1. Allikmets, R., and M. Dean, 2008. Bringing age-related macular degeneration into focus. Nat. Genet. 40 820–821. - PubMed
    1. Altmuller, J., L. J. Palmer, G. Fischer, H. Scherb and M. Wjst, 2001. Genomewide scans of complex human diseases: true linkage is hard to find. Am. J. Hum. Genet. 69 936–950. - PMC - PubMed
    1. Altmuller, J., C. Seidel, Y. A. Lee, S. Loesgen, D. Bulle et al., 2005. Phenotypic and genetic heterogeneity in a genome-wide linkage study of asthma families. BMC Pulm. Med. 5 1. - PMC - PubMed

Publication types