. 2008 Sep 21;53(18):4855-73.
doi: 10.1088/0031-9155/53/18/001. Epub 2008 Aug 18.

On the impact of longitudinal breathing motion randomness for tomotherapy delivery

Affiliations

On the impact of longitudinal breathing motion randomness for tomotherapy delivery

Michael W Kissick et al. Phys Med Biol. .

Abstract

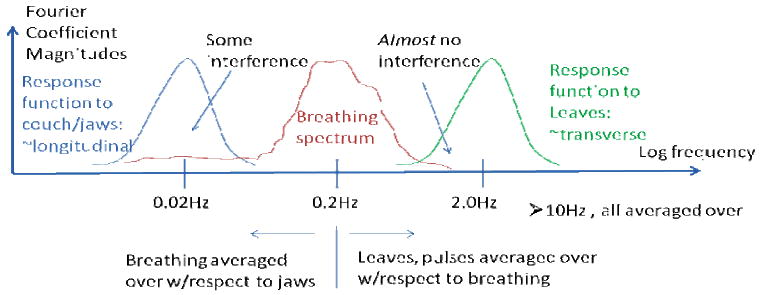
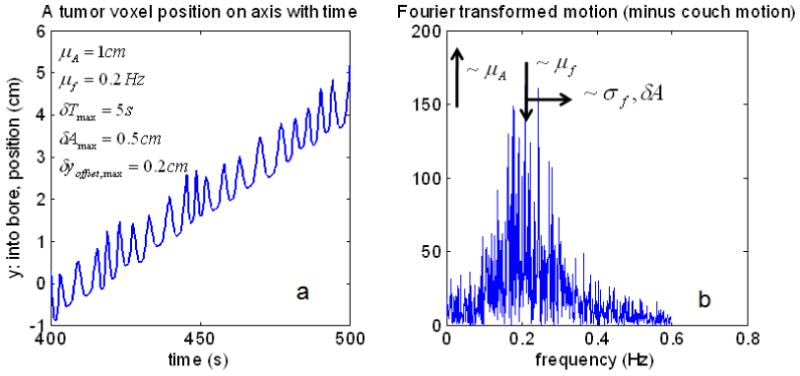
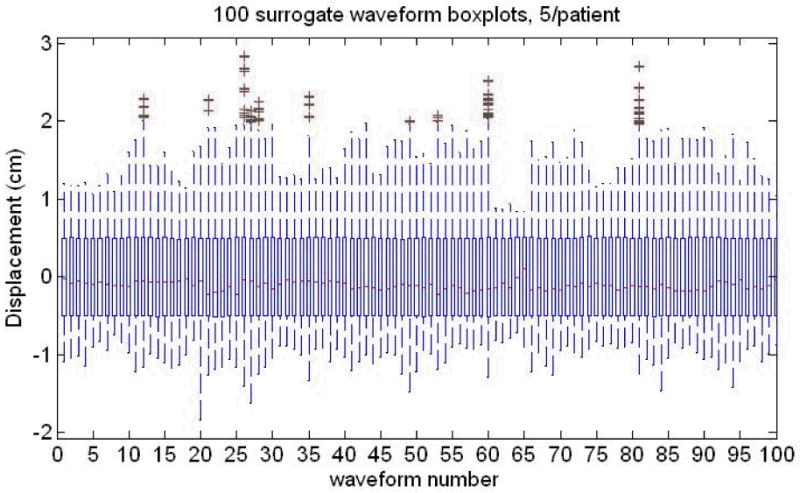
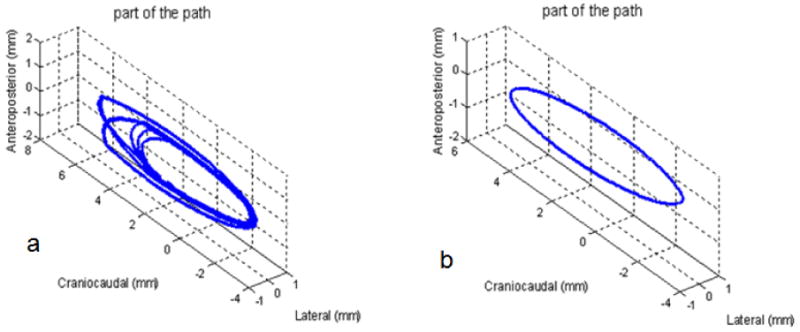
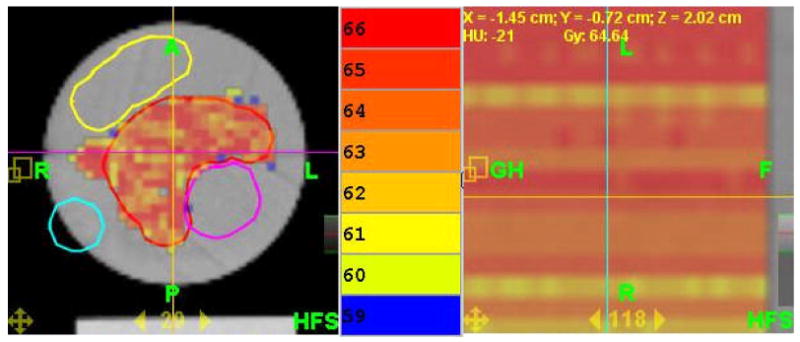
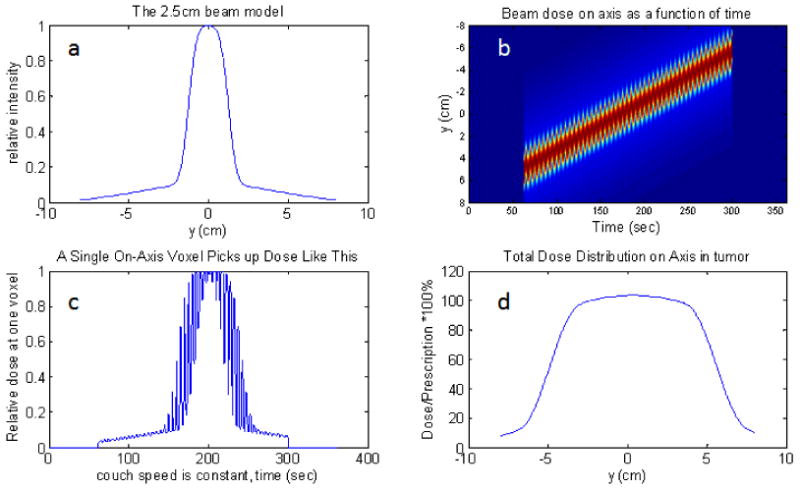
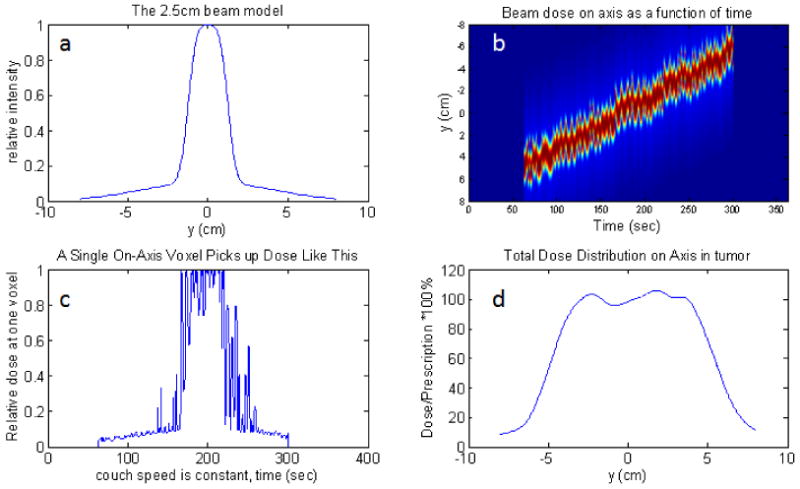
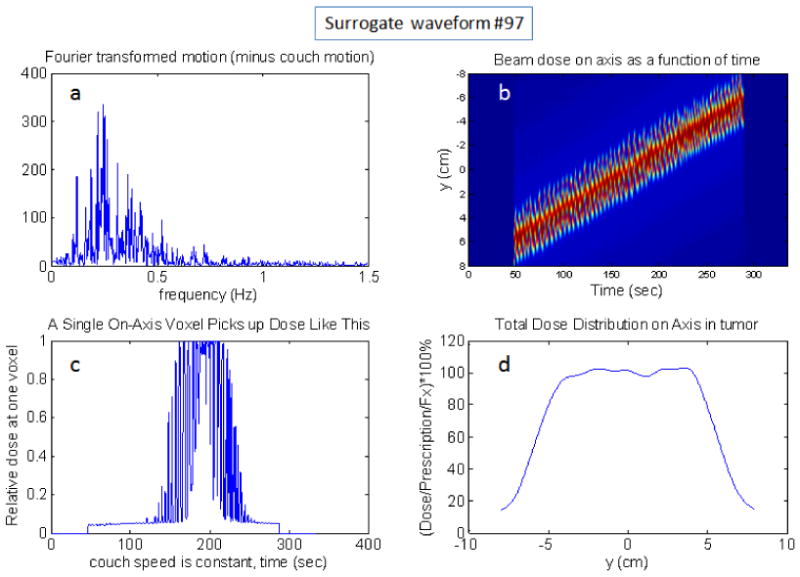
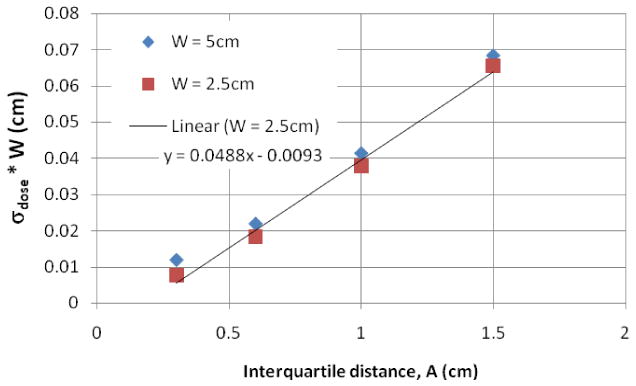
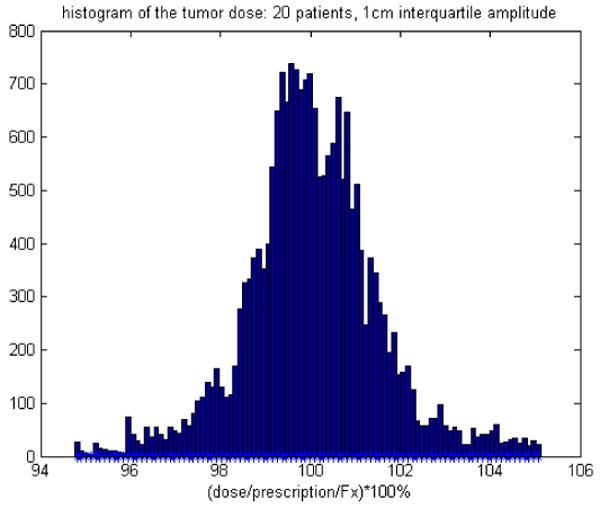
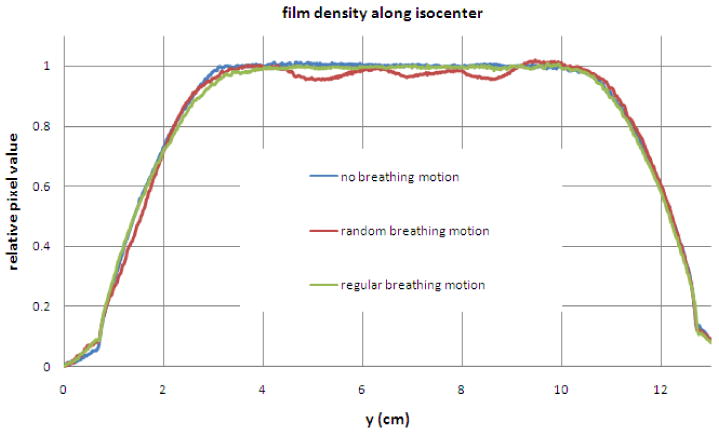
The purpose of this study is to explain the unplanned longitudinal dose modulations that appear in helical tomotherapy (HT) dose distributions in the presence of irregular patient breathing. This explanation is developed by the use of longitudinal (1D) simulations of mock and surrogate data and tested with a fully 4D HT delivered plan. The 1D simulations use a typical mock breathing function which allows more flexibility to adjust various parameters. These simplified simulations are then made more realistic by using 100 surrogate waveforms all similarly scaled to produce longitudinal breathing displacements. The results include the observation that, with many waveforms used simultaneously, a voxel-by-voxel probability of a dose error from breathing is found to be proportional to the realistically random breathing amplitude relative to the beam width if the PTV is larger than the beam width and the breathing displacement amplitude. The 4D experimental test confirms that regular breathing will not result in these modulations because of the insensitivity to leaf motion for low-frequency dynamics such as breathing. These modulations mostly result from a varying average of the breathing displacements along the beam edge gradients. Regular breathing has no displacement variation over many breathing cycles. Some low-frequency interference is also possible in real situations. In the absence of more sophisticated motion management, methods that reduce the breathing amplitude or make the breathing very regular are indicated. However, for typical breathing patterns and magnitudes, motion management techniques may not be required with HT because typical breathing occurs mostly between fundamental HT treatment temporal and spatial scales. A movement beyond only discussing margins is encouraged for intensity modulated radiotherapy such that patient and machine motion interference will be minimized and beneficial averaging maximized. These results are found for homogeneous and longitudinal on-axis delivery for unplanned longitudinal dose modulations.


Figures

Fig. 1
Fig. 1
A pictorial overview of the basic interference and averaging physics of respiratory motion and helical tomotherapy.
Fig. 2
Fig. 2
An example of a mock breathing function with parameters indicated, a. Its Fourier transform with parameters and their trends indicated, b.
Fig. 3
Fig. 3
The Breathing surrogate waveforms from a large set of data provided to us [see text for more information]. The interquartile distance between the 3rd and 1st quartiles is varied but made the same, A, for all 100 waveforms, 5/patient, 20 patients. Note the large variation in outliers, medians (red lines inside the boxes) both within and between patients. The thin ‘box’ for each distribution is formed by the 1st and 3rd quartiles of the breathing displacement distribution.
Fig. 4
Fig. 4
Example of the realistic motion paths used for the experiment. a. is the random motion and b. is purely regular motion. See text for more information on the parameters for each.
Fig. 5
Fig. 5
The TomoTherapy plan used in the experiment shown here with its calculated dose, transverse (left), and sagittal or longitudinal (right, note: expanded scale). The color bar is in the middle and note that the colors are separated by only 1 Gy. Also note that longitudinally in the PTV, the plan profile is very flat. The purple, yellow, and light blue structures are avoidance structures. See text for other details of the phantom and the plan.
Fig. 6
Fig. 6
The set-up at the start of the experiment is shown.
Fig. 7
Fig. 7
Purely regular motion, 1cm peak to peak amplitude on axis with a 2.5cm beam and all leaves open. The upper-left plot is the beam model, a. The upper-right is the dose(y,t) function, b. If one chooses a particular voxel in b, and plot its dose(t), then the lower left plot is obtained, c. If one time-integrates the dose for each position, then the dose profile is obtained: lower-right plot, d. Notice that there are no unwanted dose modulations in d.
Fig. 8
Fig. 8
Irregular motion with full range sampling in each parameter, 1cm peak to peak amplitude on axis with a 2.5cm beam and all leaves open. The upper-left plot, a, is the beam model. The upper-right,b, is the dose(y,t) function. If one chooses a particular voxel, and plot its dose(t), then the lower left, c, plot is obtained. If one time-integrates the dose for each position, then the dose profile is obtained: lower-right plot, d.
Fig. 9
Fig. 9
Example simulation using surrogate motion waveform number 97 with 1st to 3rd interquartile distance in the displacement histogram scaled to 1cm amplitude with a 2.5cm beam and all leaves open. The upper-left plot, a, is the Fourier transformed breathing motion (spectrum). The upper-right,b, is the dose(y,t) function. If one chooses a particular voxel, and plot its dose(t), then the lower left, c, plot is obtained. If one time-integrates the dose for each position, then the dose profile is obtained: lower-right plot, d.
Fig. 10
Fig. 10
Results of the dose variation times the beam width of 20 breathing surrogate waveforms, one per patient. The amplitude is the interquartile distance between the 3rd and 1st quartiles of the longitudinal breathing displacement. Not shown is the 1cm beam which is the same size as the breathing motion and therefore all edge – not recommended. A linear trendline is also displayed for the W=2.5cm beam, but works equally well for the 5cm beam. The standard deviation has no units since it's a deviation from a dose normalized to the per fraction dose.
Fig. 11
Fig. 11
The histogram of 20 waveforms interquartile distance between the 3rd and 1st quartiles of the longitudinal breathing displacement are at 1cm=A.
Fig. 12
Fig. 12
Profiles with about 5mm transverse average of pixel values. The regular motion provides only blurring and is even a bit better than the no motion case. The random motion case has obvious dose modulations which must not be caused by the complex leaf motion since the regular motion case shows such a smooth profile with identical leaf motions.
Fig 13
Fig 13
In this depicted example, the number of cycles experiencing the large gradient at the beam edge is on the order of 4 cycles and is proportional to the mean breathing displacement amplitude about the mean breathing frequency and inversely proportional to the couch velocity. If the beam had a square shape with no penumbra or scatter tail, then the only dose variation would be the variation in the 4 partially exposed voxels. However, the real beam has a gradient that spans much of its width. Therefore, a wide penumbra and scatter tail act to reduce the difference in roles of the beam width and the mean motion displacement amplitude. The conditions and parameters are the same as in Fig. 2.

References

    1. Chaudhari S, Rangaraj D, Goddu S, Malinowski K, Lu W, Parikh P, Low D. Breathing motion-induced dose delivery error evaluations as applied to Tomotherapy dose delivery - Talk TU-D-M100F-09. Med Phys; American Association of Physicists in Medicine, 49th Annual Meeting; Minneapolis MN, USA. July 22-26, 2007; 2007. p. 2561.
    1. Fenwick JD, Tomé WA, Kissick MW, Mackie TR. Modelling Simple Helically Delivered Dose Distributions. Phys Med Biol. 2005;50:1505–17. - PubMed
    1. Flynn RT, Kissick MW, Mehta MP, Olivera GH, Jeraj R, Mackie TR. The Impact of Linac Output Variations on Dose Distributions in Helical Tomotherapy. Phys Med Biol. 2008;53:417–30. - PMC - PubMed
    1. George R, Vedam SS, Chung TD, Ramakrishnan V, Keall PJ. The Application of the Sinusoidal Model to Lung Cancer Patient Respiratory Motion. Med Phys. 2005;32:2850–61. - PubMed
    1. Kanagaki B, Read PW, Molley JA, Larner JM, Sheng K. A Motion Phantom Study on Helical Tomotherapy: the Dosimetric Impacts of Delivery Technique and Motion. Phys Med Biol. 2007;52:243–55. - PubMed

Publication types