Review
. 2008 Nov;5(11):634-44.
doi: 10.1038/ncponc1204. Epub 2008 Aug 19.

Response criteria for glioma

Affiliations
Review

Response criteria for glioma

A Gregory Sorensen et al. Nat Clin Pract Oncol. 2008 Nov.

Abstract

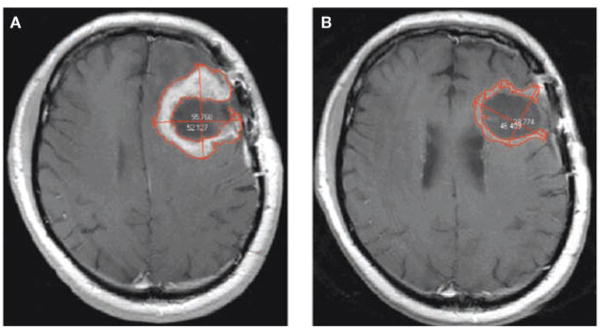
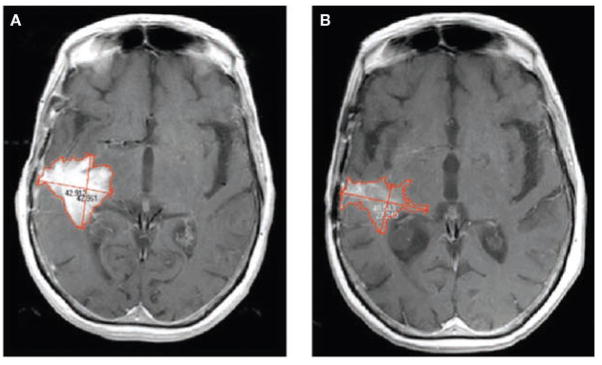
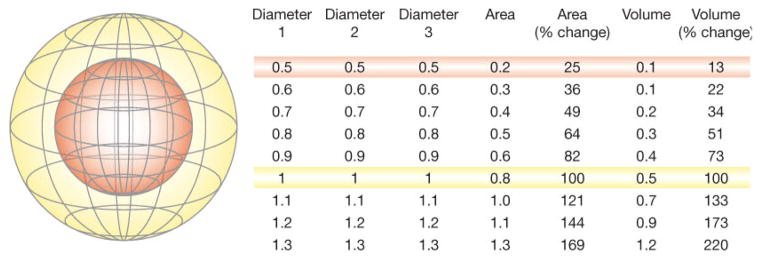
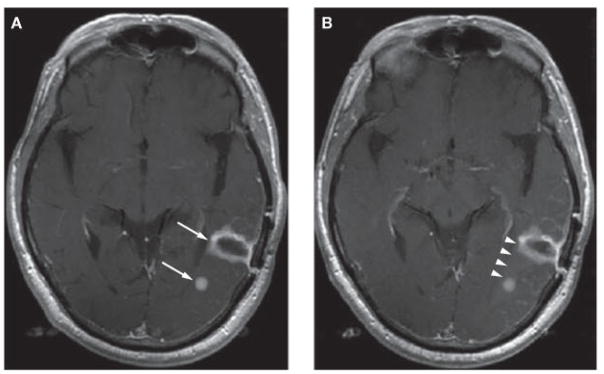
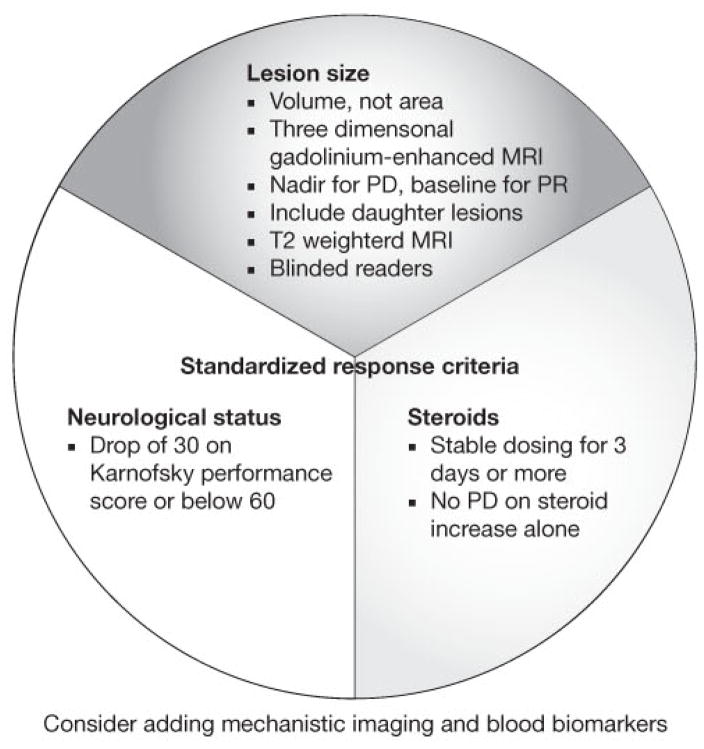
The current method for assessing the response to therapy of glial tumors was described by Macdonald et al. in 1990. Under this paradigm, response categorization is determined on the basis of changes in the cross-sectional area of a tumor on neuroimaging, coupled with clinical assessment of neurological status and corticosteroid utilization. These categories of response have certain limitations; for example, cross-sectional assessment is not as accurate as volumetric assessment, which is now feasible. Disentangling antitumor effects of therapies from their effects on blood-brain barrier permeability can be challenging. The use of insufficient response criteria might be overestimating the true benefits of drugs in early-stage studies, and, therefore, such therapies could mistakenly move forward into later phases, only to result in disappointment when overall survival is measured. We propose that studies report both radiographic and clinical response rates, use volumetric rather than cross-sectional area to measure lesion size, and incorporate findings from mechanistic imaging and blood biomarker studies more frequently, and also suggest that investigators recognize the limitations of imaging biomarkers as surrogate end points.


Conflict of interest statement

Competing interests

AG Sorensen declared associations with the following companies and organizations: ACR ImageMetrix, Amgen, AstraZeneca, Breakaway Imaging, Bayer–Schering, Eli Lilly, EPIX Pharmaceuticals, Exelixis, Genentech, General Electric Healthcare, Mitsubishi Pharma, National Institutes of Health, Novartis, Northwest Biosciences, Pfizer, Schering–Plough, Siemens Medical Solutions, Takeda-Millennium and Thermal Technologies Inc. TT Batchelor declared associations with the following companies: Enzon and Schering–Plough. RK Jain declared associations with the following companies: AstraZeneca, Dyax and SynDevRx. PY Wen declared associations with the following companies: Amgen, AstraZeneca, Exelixis, Genentech, Novartis and Schering–Plough. See the article online for full details of the relationships. W-T Zhang declared no competing interests.

Figures

Figure 1
Figure 1
MRI scans demonstrating shortcomings of the diameter method of measuring a change in glioma size. (A) T1 contrast-enhanced MRI scan of a 69-year-old male with recurrent glioblastoma, before initiation of antiangiogenic therapy. Bidimensional measurements are shown and the enhancing tumor is outlined in red as per typical volumetric analysis. In this patient the glioma is 42.912(units) by 42.961 (units), which constitutes a cross-sectional area of 55.768 mm by 52.127 mm, which constitutes a cross sectional area of 22.83cm2 (B) A scan from the same patient 29 days after initiation of chemotherapy. In this instance the glioma is 46.409mm by 38.774 mm, which constitutes a cross-sectional area of 14.13 cm2. If diameter measurements are used to estimate cross-sectional area, the lesion can be said to have shrunk to 62% of its original size, and would be classified as stable disease. According to the volume-based approach (which includes all enhancing tissue, not only on the image shown but of the entire lesion) the glioma has decreased to 28% of its original size, and would be classified as a partial response.
Figure 2
Figure 2
Shortcomings of the ellipsoid assumption used in the diameter method of measuring a change in glioma size. (A) T1 contrast-enhanced MRI scan of a 55-year-old female with recurrent glioblastoma, before therapy initiation. (B) A scan from the same individual 26 days later. Note that the lesion has not only decreased in size but also in intensity of enhancement. According to the diameter-based cross-sectional area technique, the lesion has decreased to 72% of its original size, and would be classified in the stable disease category. On the basis of the volume of enhancement, the lesion is 35% of its original size, and would be classified as a partial response.
Figure 3
Figure 3
Sensitivity of volume compared with area for the determination of change in tumor size. The inner sphere (red) has half the diameter of the outer sphere (yellow), a quarter of the relative area, and an eighth of the relative volume, as shown in the table on the right that describes diameters, areas, and volumes (with red and yellow sphere values highlighted). Using a threshold of a 50% change in high quality volume measurements would allow patients who are responding to treatment to be identified earlier than would be the case with a 50% change in area measurements.
Figure 4
Figure 4
When neuroimaging gliomas, ‘daughter’ lesions should be counted as part of the parent malignancy. (A) An MRI scan of a 69-year-old male with recurrent glioblastoma. Arrows show two areas of enhancement that might be considered separate lesions. (B) The same patient on repeat imaging the next day. There is a faint suggestion of enhancement connecting the two affected areas (arrowheads). Due to the infiltrative nature of glioma these are the same lesion with different foci of enhancement. Had the small focus appeared on a follow-up scan, we would propose considering that this region represents growth of the parent lesion rather than a new focus that would lead to classification of the patient as having progressive disease.
Figure 5
Figure 5
A schematic showing recommendations for glioma standardized response criteria. The figure identifies three key components: lesion size, neurological status, and steroids. Elaborations on these recommendations are described in Tables 2 and 3. Abbreviations: PD, progressive disease; PR, partial response.

References

    1. The Online NewsHour (online 28 March 2007) Extended interview: Janet Woodcock discusses cancer biomarkers. [accessed 28 April 2007]; http://www.pbs.org/newshour/bb/health/jan-june07/cancerwoodcock_03-28.html.
    1. Woodcock J. [accessed 28 April 2007];The Critical Path initiative: one year later. online 5 May 2005. www.fda.gov/cder/regulatory/medlmaging/woodcock.ppt.
    1. Johnson JR, et al. End points and United States Food and Drug Administration approval of oncology drugs. J Clin Oncol. 2003;21:1404–1411. - PubMed
    1. Macdonald DR, et al. Response criteria for phase II studies of supratentorial malignant glioma. J Clin Oncol. 1990;8:1277–1280. - PubMed
    1. Brada M, Yung WK. Clinical trial end points in malignant glioma: need for effective trial design strategy. Semin Oncol. 2000;27:11–19. - PubMed

Publication types

MeSH terms