. 2009 Jan;87(1):164-70.
doi: 10.1002/jnr.21826.

Effects of neuroglobin overexpression on mitochondrial function and oxidative stress following hypoxia/reoxygenation in cultured neurons

Affiliations

Effects of neuroglobin overexpression on mitochondrial function and oxidative stress following hypoxia/reoxygenation in cultured neurons

Jianxiang Liu et al. J Neurosci Res. 2009 Jan.

Abstract

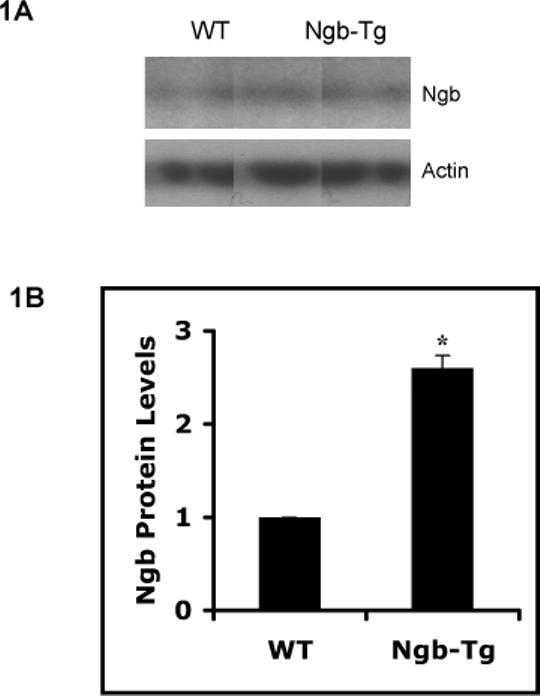
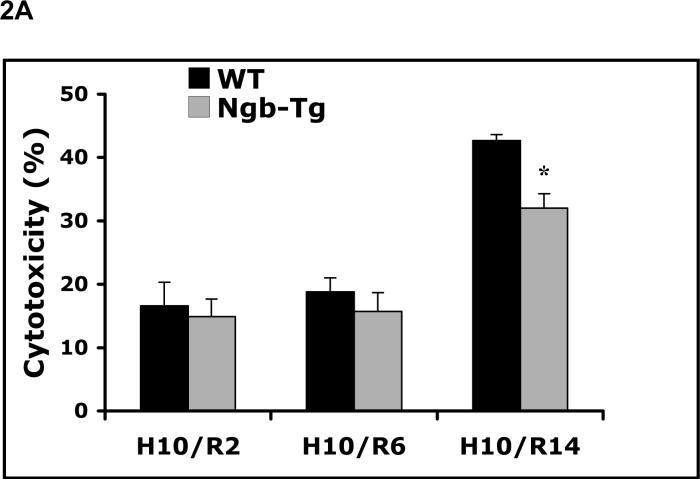
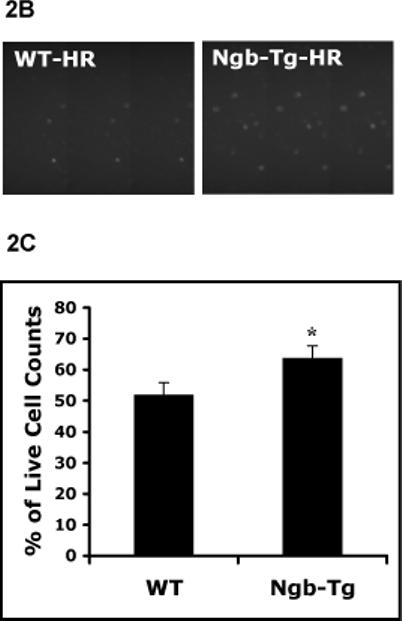
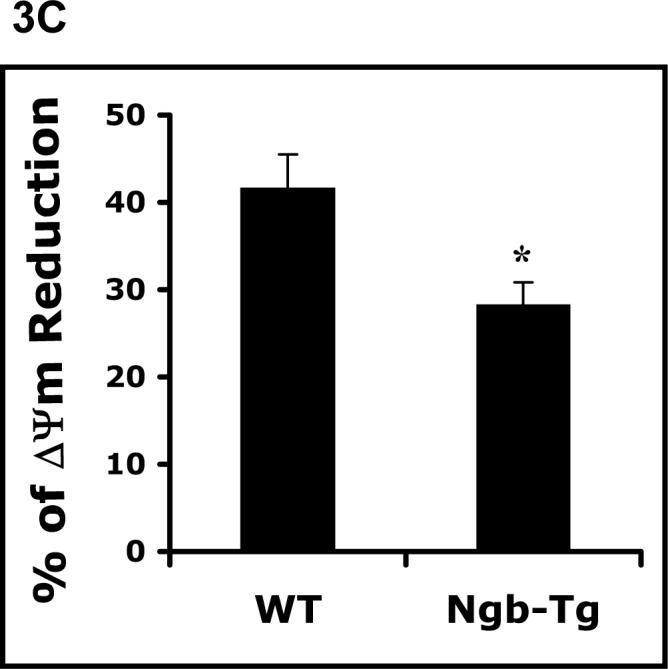
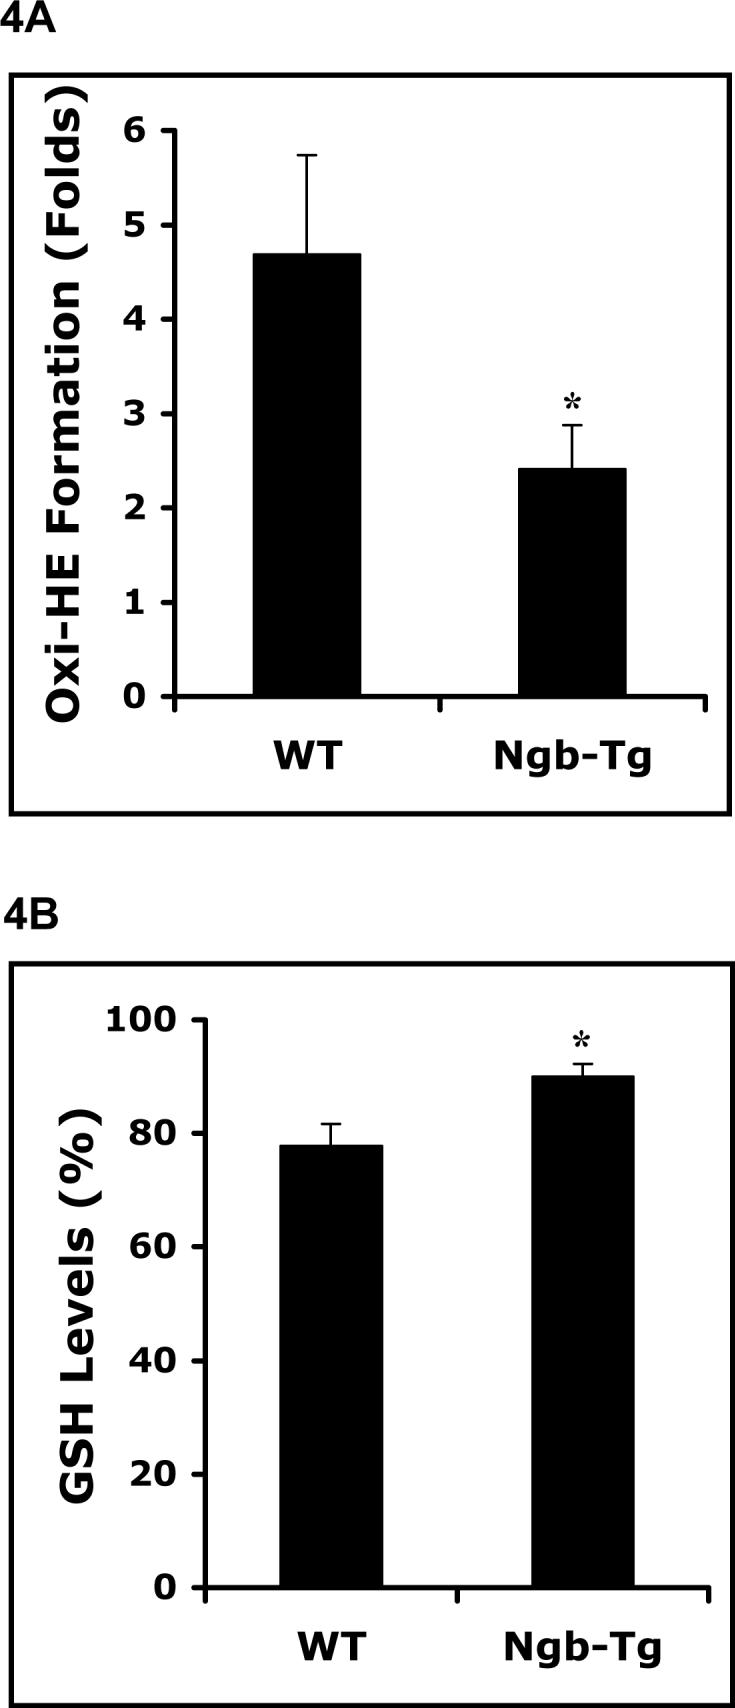
Neuroglobin (Ngb) is a recently discovered tissue globin with a high affinity for oxygen that is widely and specifically expressed in neurons of vertebrate central and peripheral nervous systems. Our laboratory and others have shown Ngb overexpression can protect neurons against hypoxic/ischemic insults, but the underlying mechanisms remain poorly understood. In this study, we examined the effects of Ngb overexpression on mitochondrial function, oxidative stress, and neurotoxicity in primary cortical neurons following hypoxia/reoxygenation (H/R). Ngb-overexpressing transgenic neurons (Ngb-Tg) were significantly protected against H/R-induced cell death. Rates of decline in ATP levels, MTT reduction, and mitochondrial membrane potential were significantly ameliorated in Ngb-Tg neurons. Furthermore, Ngb overexpression reduced superoxide anion generation after H/R, whereas glutathione levels were significantly improved compared with WT controls. Taken together, these data suggest that Ngb is neuroprotective against hypoxia, in part by improving mitochondria function and decreasing oxidative stress.


Figures

Figure 1
Figure 1
Increase of Ngb protein expression in Ngb-Tg cortical neuron cultures. A. Representative western blot showed Ngb-Tg neurons had higher Ngb protein levels compared to WT controls. Actin served as equal loading controls. B. Relative Ngb protein expression levels were quantified by optical density of Ngb protein bands. Mean±SEM, n=3 per group, *P<0.05.
Figure 2
Figure 2
Reduction of neurotoxicity in Ngb over-expressing neurons after H/R. A. Primary cortical neuronal cultures were derived from 15 days old embryonic cortex of Ngb-Tg and WT brains. Time course of neurotoxicity after H/R was examined with LDH release assay. There was no significant difference in neurotoxicity after hypoxia 10 hrs followed by reoxygenation for 2 hrs (H10/R2) and 6 hrs (H10/R6), but Ngb-Tg neurons significantly reduced neurotoxicity after reoxygenation for 14 hrs (H10/R14), compared to WT neurons. Mean±SEM, n=5 per group, *P<0.05. B. Live cell count assay was used to measure neurotoxicity after 10 hr hypoxia followed by 14 hr reoxygenation. Up panel showed representative images of calcein AM staining identified increased live neurons in Ngb-Tg neuron cultures after H/R compared with WT controls. Lower panel showed quantification of the percentage of live cell counts was significantly increased in Ngb-Tg compared to WT neuron cultures. Mean±SEM, n=10 per group, *P<0.05.
Figure 2
Figure 2
Reduction of neurotoxicity in Ngb over-expressing neurons after H/R. A. Primary cortical neuronal cultures were derived from 15 days old embryonic cortex of Ngb-Tg and WT brains. Time course of neurotoxicity after H/R was examined with LDH release assay. There was no significant difference in neurotoxicity after hypoxia 10 hrs followed by reoxygenation for 2 hrs (H10/R2) and 6 hrs (H10/R6), but Ngb-Tg neurons significantly reduced neurotoxicity after reoxygenation for 14 hrs (H10/R14), compared to WT neurons. Mean±SEM, n=5 per group, *P<0.05. B. Live cell count assay was used to measure neurotoxicity after 10 hr hypoxia followed by 14 hr reoxygenation. Up panel showed representative images of calcein AM staining identified increased live neurons in Ngb-Tg neuron cultures after H/R compared with WT controls. Lower panel showed quantification of the percentage of live cell counts was significantly increased in Ngb-Tg compared to WT neuron cultures. Mean±SEM, n=10 per group, *P<0.05.
Figure 3
Figure 3
Amelioration of mitochondrial disruption in Ngb over-expressing neurons after H/R. A. Time-course of ATP levels was examined after hypoxia 10 hrs (H10), and followed by repxygenation for 2 hrs and 6 hrs. Levels of ATP in Ngb-Tg neurons were significantly higher at all three time points compared with WT neurons. B. Time- course of MTT reduction was measured after hypoxia 10 hrs followed by reoxygenation for 2 hrs (H10/R2), and 6 hrs (H10/R6). MTT reduction in Ngb-Tg neurons were significantly increased at the two time points compared with WT neurons. Mean±SEM, n=4, *p<0.05. C. ΔΨm was measured after 10 hr hypoxia followed by 2 hr reoxygenation, the ΔΨm reduction rate in Ngb-Tg neurons was significantly inhibited compared to WT controls. Mean±SEM, n=10 per group, *p<0.05.
Figure 3
Figure 3
Amelioration of mitochondrial disruption in Ngb over-expressing neurons after H/R. A. Time-course of ATP levels was examined after hypoxia 10 hrs (H10), and followed by repxygenation for 2 hrs and 6 hrs. Levels of ATP in Ngb-Tg neurons were significantly higher at all three time points compared with WT neurons. B. Time- course of MTT reduction was measured after hypoxia 10 hrs followed by reoxygenation for 2 hrs (H10/R2), and 6 hrs (H10/R6). MTT reduction in Ngb-Tg neurons were significantly increased at the two time points compared with WT neurons. Mean±SEM, n=4, *p<0.05. C. ΔΨm was measured after 10 hr hypoxia followed by 2 hr reoxygenation, the ΔΨm reduction rate in Ngb-Tg neurons was significantly inhibited compared to WT controls. Mean±SEM, n=10 per group, *p<0.05.
Figure 4
Figure 4
Reduction of oxidative stress in Ngb over-expressing neurons after H/R. A. Oxidized HE production was reduced in Ngb-Tg neurons after hypoxia for 10 hrs followed by 2 hr reoxygenation compared with WT neurons examined with fluorescent plate reader. B. Glutathione level of normal controls in Ngb-Tg neurons was significantly increased after hypoxia for 10 hrs and followed by 4 hrs reoxygenation compared with WT neurons. Mean±SEM, n=4 for each group. *P<0.05.

References

    1. Awenius C, Hankeln T, Burmester T. Neuroglobins from the zebrafish Danio rerio and the pufferfish Tetraodon nigroviridis. Biochem Biophys Res Commun. 2001;287(2):418–421. - PubMed
    1. Bentmann A, Schmidt M, Reuss S, Wolfrum U, Hankeln T, Burmester T. Divergent distribution in vascular and avascular mammalian retinae links neuroglobin to cellular respiration. J Biol Chem. 2005;280(21):20660–20665. - PubMed
    1. Bredesen DE, Rao RV, Mehlen P. Cell death in the nervous system. Nature. 2006;443(7113):796–802. - PMC - PubMed
    1. Brunori M, Giuffre A, Nienhaus K, Nienhaus GU, Scandurra FM, Vallone B. Neuroglobin, nitric oxide, and oxygen: functional pathways and conformational changes. Proc Natl Acad Sci U S A. 2005;102(24):8483–8488. - PMC - PubMed
    1. Bunn HF, Poyton RO. Oxygen sensing and molecular adaptation to hypoxia. Physiol Rev. 1996;76(3):839–885. - PubMed

Publication types

MeSH terms