. 2009 Jan;87(1):218-27.
doi: 10.1002/jnr.21827.

Differential subcellular distribution and colocalization of the microsomal and soluble epoxide hydrolases in cultured neonatal rat brain cortical astrocytes

Affiliations

Differential subcellular distribution and colocalization of the microsomal and soluble epoxide hydrolases in cultured neonatal rat brain cortical astrocytes

Seema Rawal et al. J Neurosci Res. 2009 Jan.

Abstract

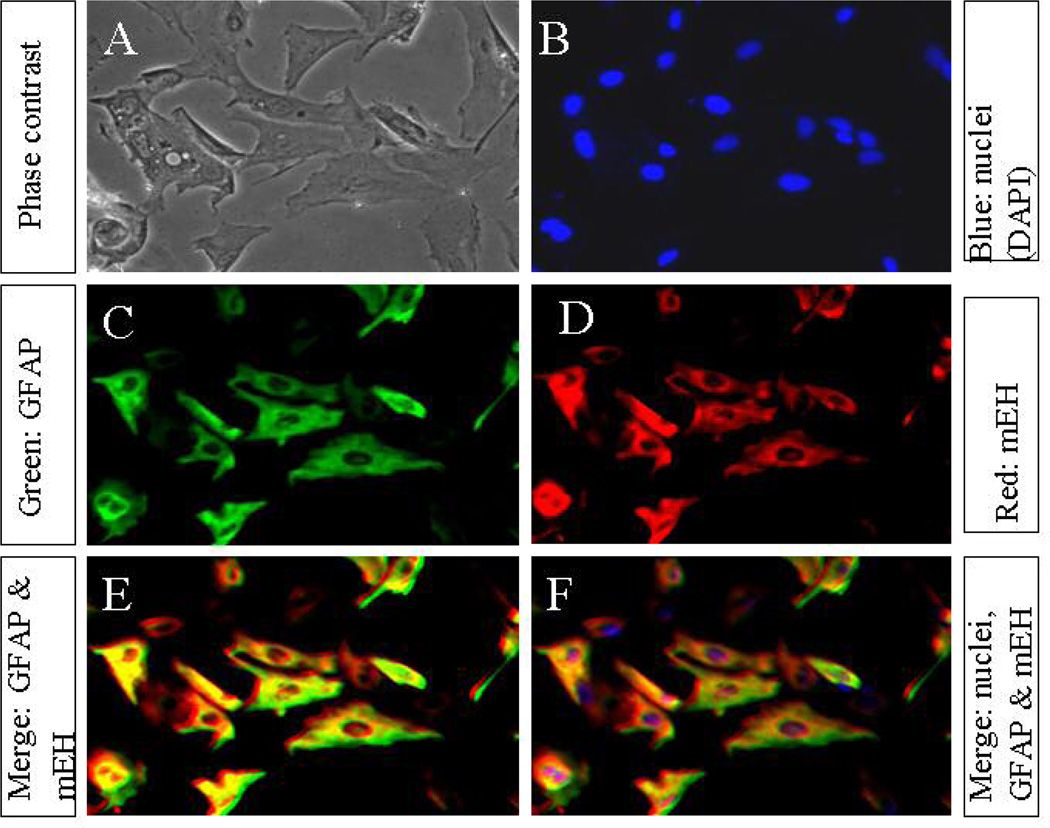
The microsomal epoxide hydrolase (mEH) and soluble epoxide hydrolase (sEH) enzymes exist in a variety of cells and tissues, including liver, kidney, and testis. However, very little is known about brain epoxide hydrolases. Here we report the expression, localization, and subcellular distribution of mEH and sEH in cultured neonatal rat cortical astrocytes by immunocytochemistry, subcellular fractionation, Western blotting, and radiometric enzyme assays. Our results showed a diffuse immunofluorescence pattern for mEH, which colocalized with the astroglial cytoskeletal marker glial fibrillary acidic protein (GFAP). The GFAP-positive cells also expressed sEH, which was localized mainly in the cytoplasm, especially in and around the nucleus. Western blot analyses revealed a distinct protein band with a molecular mass of approximately 50 kDa, the signal intensity of which increased about 1.5-fold in the microsomal fraction over the whole-cell lysate and other subcellular fractions. The polyclonal anti-human sEH rabbit serum recognized a protein band with a molecular mass similar to that of the affinity-purified sEH protein (approximately 62 kDa), the signal intensity of which increased over 1.7-fold in the 105,000g supernatant fraction over the cell lysate. Furthermore, the corresponding enzyme activities measured by using mEH- and sEH-selective substrates generally corroborated the immunocytochemical and Western blotting data. These results suggest that rat brain cortical astrocytes differentially coexpress mEH and sEH enzymes. The differential subcellular localization of mEH and sEH may play a role in the cerebrovascular functions that are known to be affected by brain-derived vasoactive epoxides.


Figures

Figure 1
Figure 1. Immunofluorescence co-localization of GFAP and mEH in cultured astrocytes
The secondary cultures of neonatal rat cortical astrocytes (10,000 cells, A–F), grown on coverslips, were methanol-fixed, double-stained with immunofluorescent probes for GFAP, and mEH proteins and then visualized by immunofluorescence microscopy. (A) Typical phase contrast view of the total number of flat monolayer of polygonal cells in a given field. (B) Nuclear staining with DAPI showing the nuclei (blue fluorescence) in the corresponding field. (C) Shows GFAP-positive cells in the same field, stained green with FITC-conjugated secondary antibody. (D) Cells in the corresponding field showing the expression of mEH protein, stained red with TRITC conjugated secondary antibody. (E and F) Co-localization of GFAP- and mEH proteins by merging the images (B, C and D) showing obvious cytosolic co-localization appearing yellowish-red immunofluorescence. The photomicrographs (A–F) at magnification 20X represent a typical field on one of three preparations from three different experiments.
Figure 2
Figure 2. Immunofluorescence co-localization of GFAP and sEH in cultured astrocytes
The secondary cultures of neonatal rat cortical astrocytes (10,000 cells, A–F)), grown on coverslips, were methanol-fixed, double-stained with immunofluorescent probes for GFAP, and sEH proteins and then visualized by immunofluorescence microscopy. (A) Typical phase contrast view of the total number of flat monolayer of polygonal cells in a given field. (B) Nuclear staining with DAPI showing the nuclei (blue fluorescence) in the corresponding field. (C) Shows GFAP-positive cells in the same field, stained green with FITC-conjugated secondary antibody. (D) Cells in the corresponding field showing the expression of sEH protein, stained the cytosol as well as the nucleus red with TRITC conjugated secondary antibody. (E) Co-localization of GFAP- and sEH proteins in the cytosol, after merging the images (B, and C), appearing yellowish-red immunofluorescence, while the non-merged nucleus appeared bright red. (F) Colocalization of nuclear stain DAPI with GFAP and sEH (B, C and D), appearing yellowish red cytosol and Magenta-colored nucleus. The photomicrographs (A-F) at magnification 20X represent a typical field on one of three preparations from three different experiments.
Figure 3
Figure 3. Immunofluorescence co-localization of mEH and sEH in cultured astrocytes
The secondary cultures of neonatal rat cortical astrocytes (10,000 cells, A–F)), grown on coverslips, were methanol-fixed, double-stained with immunofluorescent probes for mEH, and sEH proteins and then visualized by immunofluorescence microscopy. (A) Typical phase contrast view of the total number of flat monolayer of polygonal cells in a given field. (B) Nuclear staining with DAPI showing the nuclei (blue fluorescence) in the corresponding field. (C) Shows mEH-positive cells in the same field, stained red with TRITC-conjugated secondary antibody. (D) Cells in the corresponding field showing the expression of sEH protein in the cytosol as well as the nucleus green with FITCconjugated secondary antibody. (E and F) Co-localization of mEH and sEH proteins in the cytosol, after merging the images (B, and C), which appeared yellowish-red immunofluorescence, while the non-merged nucleus appeared bright green. (F) Colocalization of nuclear stain DAPI with GFAP and sEH (B, C and D), appearing yellowish red cytosol and blue-green nucleus. The photomicrographs (A–F) at magnification 20X represent a typical field on one of three preparations from three different experiments.
Figure 4
Figure 4. Representative Immunoblots showing mEH (A) and sEH (D) immunoreactivity
Cell lysate, from the secondary cultures of neonatal rat cortical astrocytes, was subjected to subcellular fractionation as described previously (Pacifici et al., 1988), the proteins (10µg each) from various fractions were separated by 10% SDS-PAGE, and transferred to PVDF membranes for visualizing specific immunoreactivity after incubating with primary and HRP-conjugated secondary mEH and sEH antibodies. (A) Immunoblot showing mEH immunoreactive protein bands in the cell lysate (lane1), mitochondrial fraction (Lane 2), microsomal fraction (lanes 3), nuclear fraction (lane 4), 105,000×g supernatant (soluble) fraction (lane 5), and affinity-purified soluble epoxide hydrolase protein (lane6; 2ng protein), respectively. The mEH protein immunoreactivity was distinct at 50 KDa. The immunoreactivity of β-actin protein was used as loading control after stripping and reprobing the above blot with polyclonal anti-β-actin IgG (1:1000 dilutions) to check the amount of the protein loaded in all the wells as described under Materials and methods Section. (B) The bar graphs depict the ratio of mEH to β-actin in cell lysate, mitochondrial, microsomal, nuclear and soluble fractions corresponding to lanes 1–5, respectively, and expressed as arbitrary units of signal intensity. (C) Immunoblot showing sEH immunoreactive protein bands in the cell lysate (lane1), mitochondrial fraction (Lane 2), microsomal fraction (lanes 3), nuclear fraction (lane 4), 105,000×g supernatant (soluble) fraction (lane 5), and affinity-purified soluble epoxide hydrolase protein (lane 6; 2ng protein), respectively. The molecular mass of affinity purified sEH protein corresponded to ~62 KDa. The immunoreactivity of β-actin protein was used as loading control after stripping and reprobing the above blot with polyclonal anti-β-actin IgG (1:1000 dilutions) to check the amount of the protein loaded in all the wells as described under Materials and methods Section. (D) The bar graphs depict the ratio of sEH to β-actin in cell lysate, mitochondrial, microsomal, nuclear and soluble fractions corresponding to lanes 1–5, respectively, and expressed as arbitrary units of signal intensity. The blots shown are representatives of four repetitions.

References

    1. Amruthesh SC, Boerschel MF, Mckinney JS, Willoughby KA, Ellis EF. Metabolism of Arachidonic Acid to Epoxyeicosatrienoic Acids, Hydroxyeicosatetraenoic Acids, and Prostaglandins in Cultured Rat Hippocampal Astrocytes. J.Neurochem. 1993;61:150–159. - PubMed
    1. Arand M, Cronin A, Adamska M, Oesch F. Epoxide Hydrolases: Structure, Function, Mechanism, and Assay. In. Methods in Enzymol. 2005;400:569–588. - PubMed
    1. Borhan B, Mebrahtu T, Nazarian S, Kurth MJ, Hammock BD. Improved radiolabeled substrates for soluble epoxide hydrolase. Anal Biochem. 1995;231:188–200. - PubMed
    1. Bradford MM. A Rapid and sensitive method for the quantitation of microgram quantities of protein utilizing the principle of protein–dye binding. Anal Biochem. 1976;72:248–254. - PubMed
    1. Capdevila JH, Falck JR, Harris RC. Cytochrome P450 and arachidonic acid bioactivation. Molecular and functional properties of the arachidonate monooxygenase. J Lipid Res. 2000;41:163–181. - PubMed

Publication types

Substances