

doi: 10.1148/radiology.180.3.1871278.
Noninvasive measurement of transmural gradients in myocardial strain with MR imaging
Affiliations
- PMID: 1871278
- PMCID: PMC2475677
- DOI: 10.1148/radiology.180.3.1871278
Item in Clipboard
Noninvasive measurement of transmural gradients in myocardial strain with MR imaging
Radiology.
1991 Sep.
Abstract
A method is presented for performing high-resolution strain measurements by using magnetic resonance (MR) tagging. Multispectral radiofrequency pulses are used to produce tagging grids from which strain estimates are obtained with a resolution of 2 mm. A tag detection algorithm is presented that measures the center of a tag line with a precision that ranges from 0.1 to 0.2 mm over the systolic interval. With this method, a transmural gradient in the strain of a normal dog heart was detected.
Figures
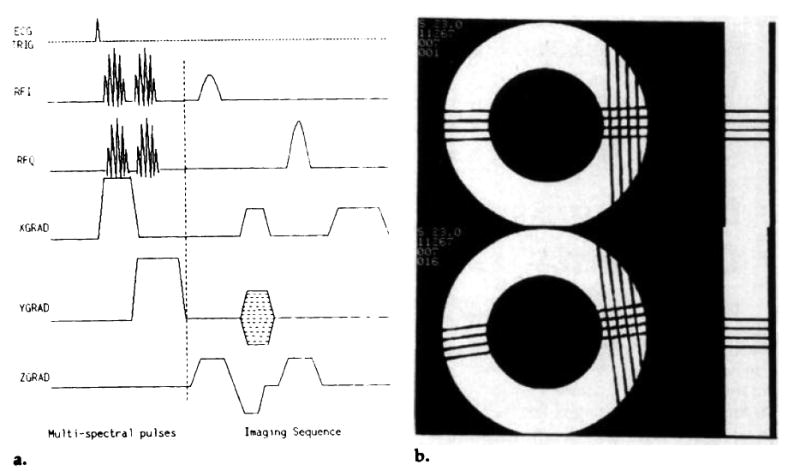
(a) A multispectral, radio-frequency pulse tagging sequence. The sinc-Hamming envelope of the tagging pulses is modulated with discrete sideband frequencies to tag a set of parallel planes simultaneously. Two multispectral pulses with orthogonal gradients were used to produce a grid. (b) A sample 4 × 4 grid of tags produced in a rotating phantom. The separation of the tag lines was 4.0 mm; the time to produce the grid pattern was 13.0 msec. The phantom experiments are explained in full in the Phantom Experiments section of the Results section.

(a) A diagram showing the components of the tag detection algorithm. The user places the initial seed points (black circles) on a zoomed image with use of a computer mouse. The dashed line shows a fit to the seed points. The solid lines perpendicular to the dashed line are the paths along which the search for the center of the tag was performed. (b) A flow chart for the algorithm used to obtain a polynomial fit to a segment of a tag line.
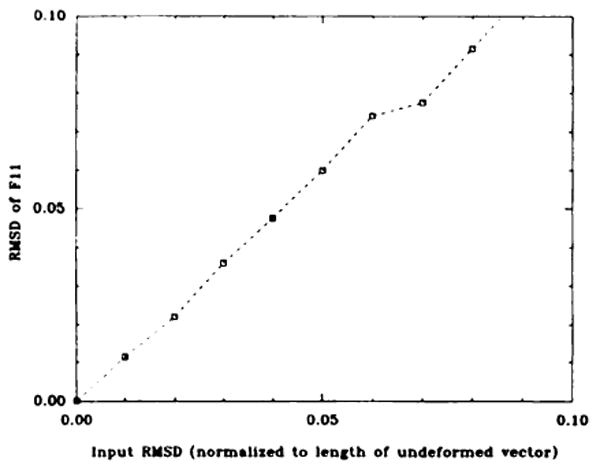
A plot of the expected uncertainty in F11 versus the root-mean-squared deviation of the position of the tag points (normalized to the length of the differential ΔX). The data were obtained from a Monte-Carlo simulation in which 400 independent data sets for each input noise level were used to calculate F. This root-mean-squared deviation on the components of F were calculated from these 400 trials. RMSD = root-mean-squared deviation.
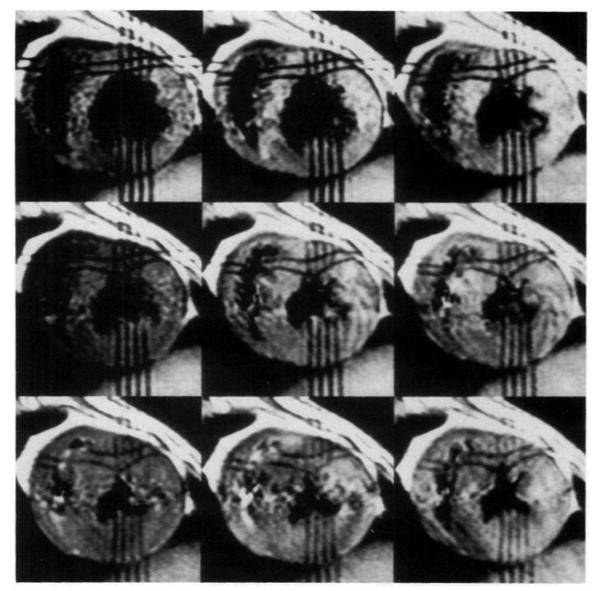
In vivo data produced with the multispectral radio-frequency pulse tagging sequence. Nine time points (25, 55, 85, 115, 145, 175, 205, 235, 265 msec) were measured through the systolic interval in the normal dog. (t = 0 was at the initial upslope of the R wave in the QRS complex.) The voxel dimensions were 0.6 × 1.2 × 5.0 mm, collected with a 256 × 128 matrix and four signals averaged. The phase-encoding direction was horizontal in these images. The total imaging time was 46 minutes. The tags were separated by 4.0 mm.

(a) A zoomed image of the grid-tag pattern in the 175-msec image seen in Figure 4. A line is drawn along a direction perpendicular to the tag. (b) A plot of pixel intensities through the tag, along the line shown in a. The solid line shows the model function,
, fit to the tag. The error bars represent the root-mean-squared deviation measured in the heart wall; this error therefore includes the nonuniform heart wall signal and the random signal from flow artifact. (c) A plot of the squared error between the model and the pixel values versus the position of the mean of the gaussian curve (μ). Notice the sharp definition of the minimum.

(a) A plot of the circumferential strain as a function of time. The strain was calculated as
, where l0 is the distance between the top left corner and bottom right corner of the tagging grid shown in the 25-msec image seen in Figure 4, and l(t) is the distance between those two points in the images at later times t. The error was computed from simple error propagation techniques by using the estimated error on l0 and l(t) obtained from the tag detection algorithm. (b) A plot of the radial strain as a function of time. The strain was calculated as in a, but the two points used were the top right and bottom left corners of the central box in the tagging grid seen in Figure 4.
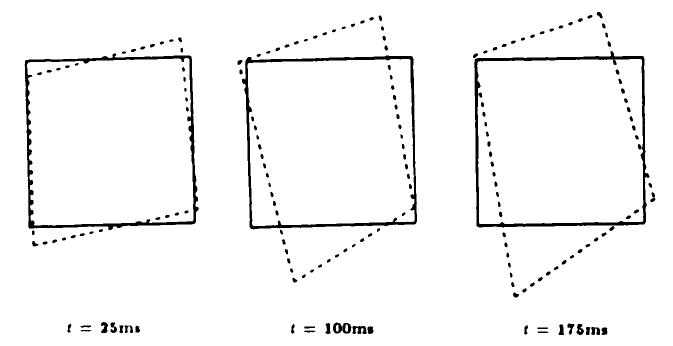
Deformation of the central box in the tagging grid seen in Figure 4 is shown at three different times.
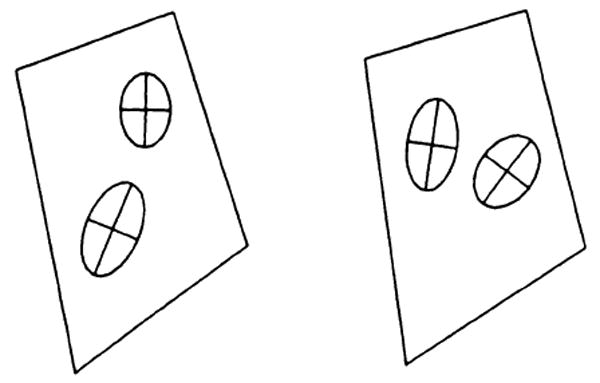
A graphic demonstration of the value of the strain in this box at the time t = 175 msec. Each ellipse shows how a circle at that location would deform. Note the transmural gradient in this strain.
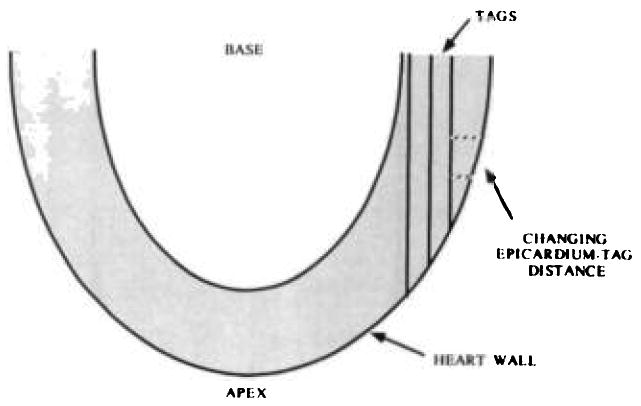
A diagram shows how the distance between the tagging planes and the epicardium can change rapidly as a function of position. This diagram shows a long-axis view of the heart. The dashed lines show the distance between the tag planes and the epicardium.
References
-
- Zerhouni EA, Parish DM, Rogers WJ, Yang A, Shapiro EP. Human heart tagging with MR imaging: a method for noninvasive assessment of myocardial motion. Radiology. 1988;169:59–63. - PubMed
-
- Hunter WC, Zerhouni EA. Imaging distinct points in left ventricular myocardium to study regional wall deformation. In: Anderson JH, editor. Innovations in diagnostic radiology. Berlin: Springer-Verlag; 1989.
-
- Ingels NB, Daughters GT, Stinson EB, Alderman EL. Measurement of midwall myocardial dynamics in intact man by radiography of surgically implanted markers. Circulation. 1975;52:859–867. - PubMed
-
- LeWinter MM, Kent RS, Kroener JM, Carew TE, Covell JW. Regional differences in myocardial performance in the left ventricle of the dog. Circ Res. 1975;37:191–199. - PubMed
-
- Sabbah HN, Marzilli M, Stein PD. The relative role of subendocardium and subepicardium in left ventricular mechanics. Am J Physiol. 1981;240:H920–H926. - PubMed
Publication types
MeSH terms
Grants and funding
LinkOut - more resources
Full Text Sources
Other Literature Sources
Medical
