. 2008 Sep;48(3):978-90.
doi: 10.1002/hep.22395.

Mechanism of T cell tolerance induction by murine hepatic Kupffer cells

Affiliations

Mechanism of T cell tolerance induction by murine hepatic Kupffer cells

Qiang You et al. Hepatology. 2008 Sep.

Abstract

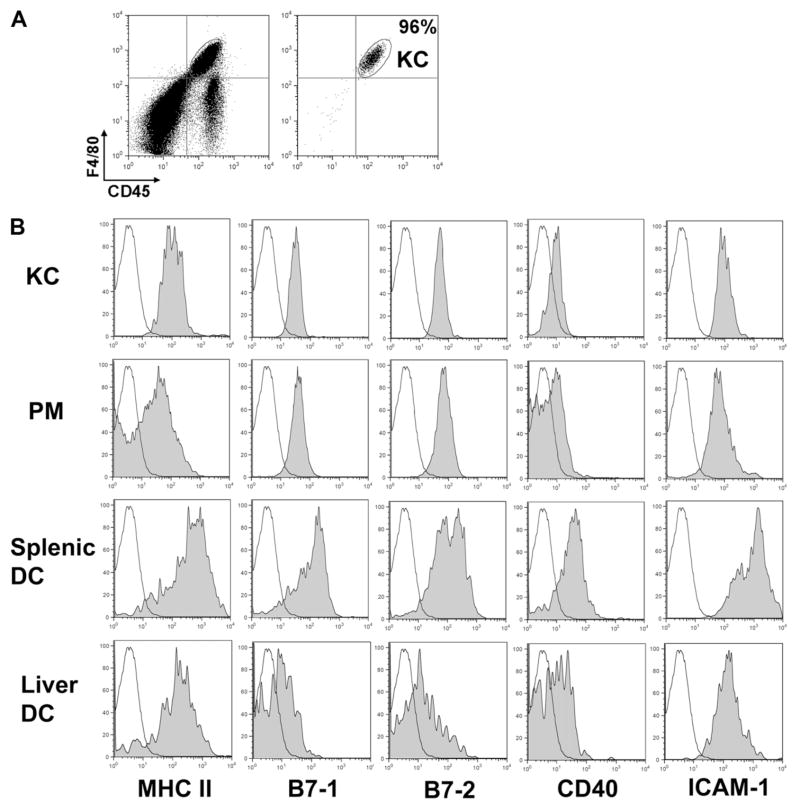
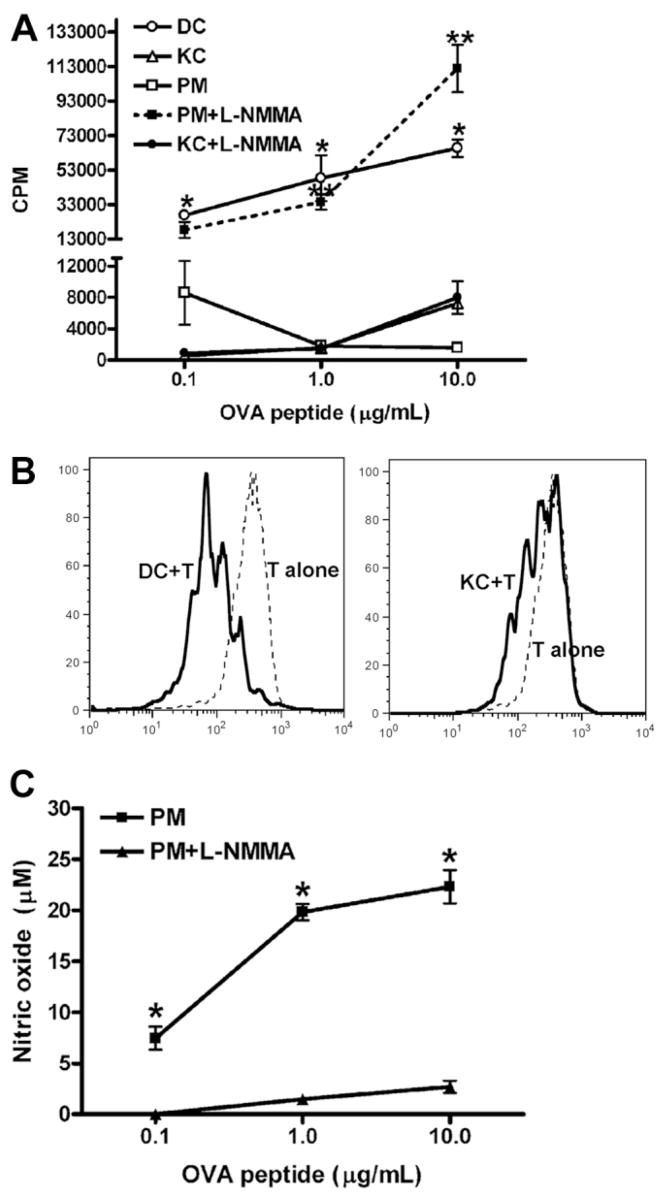
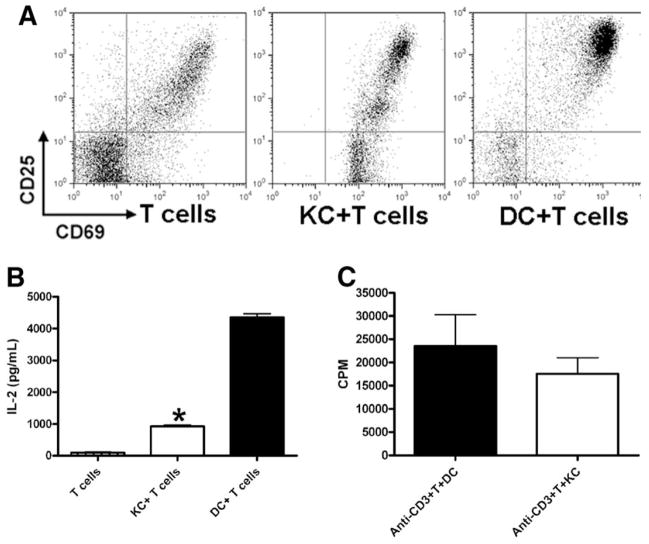
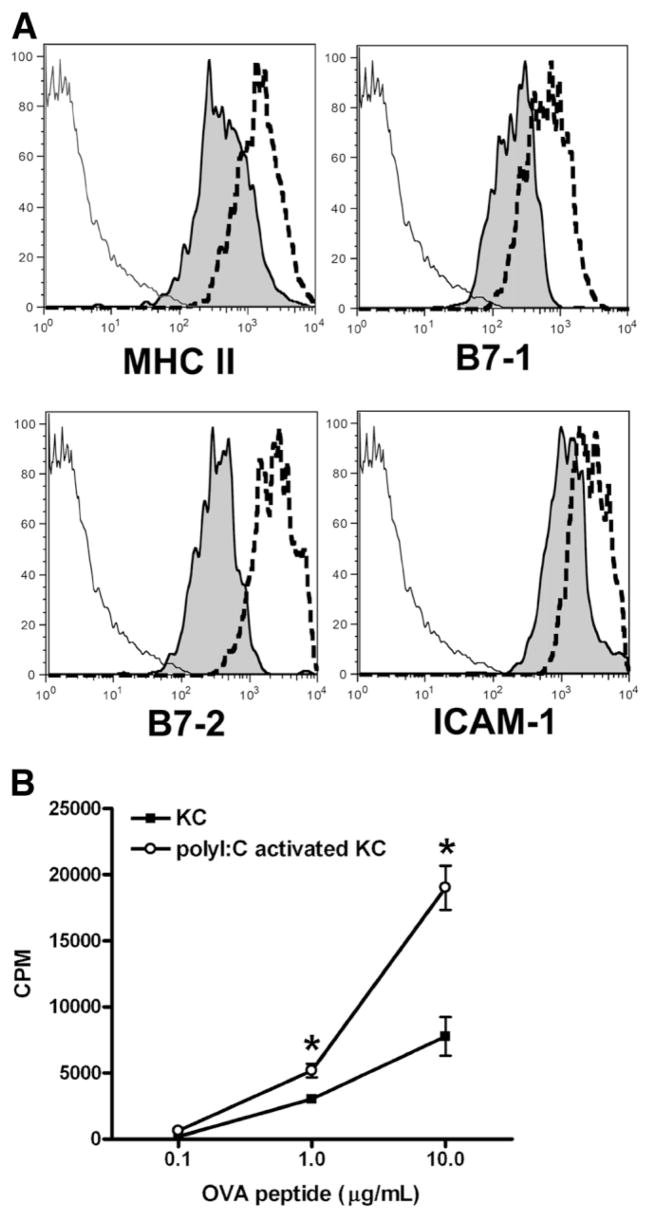
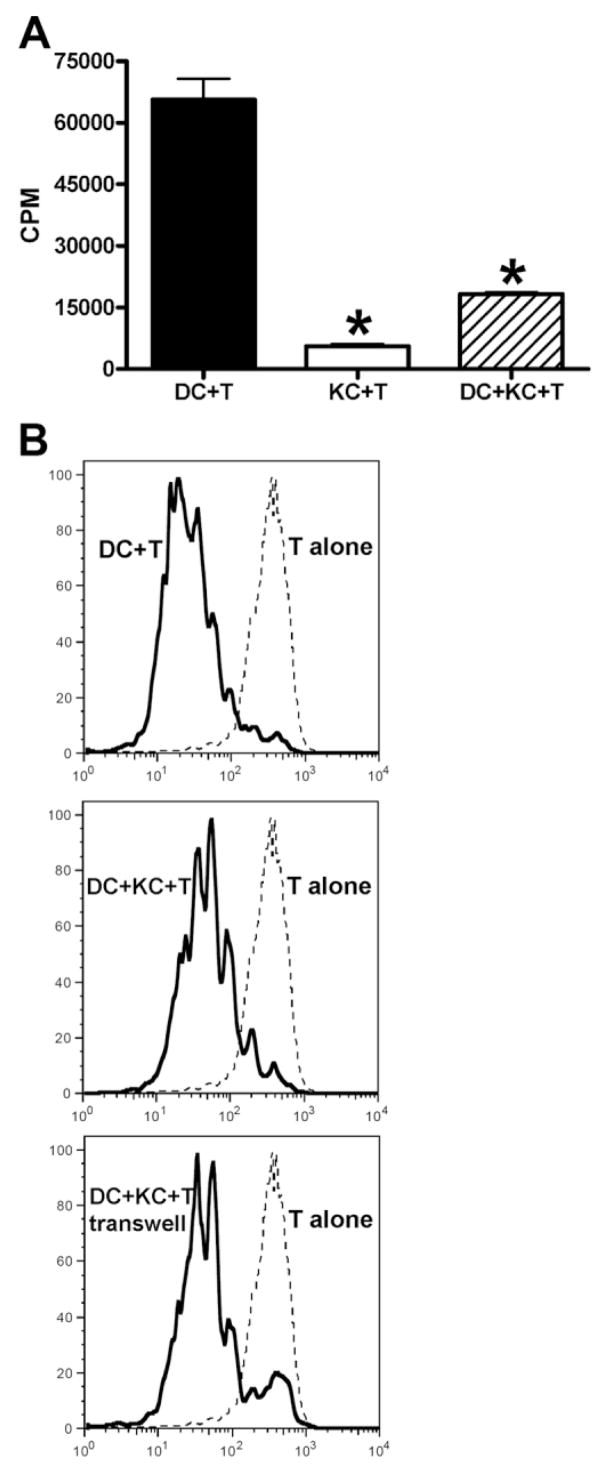
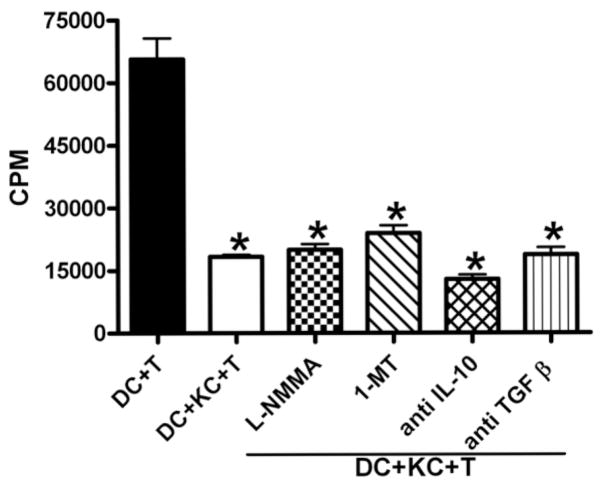
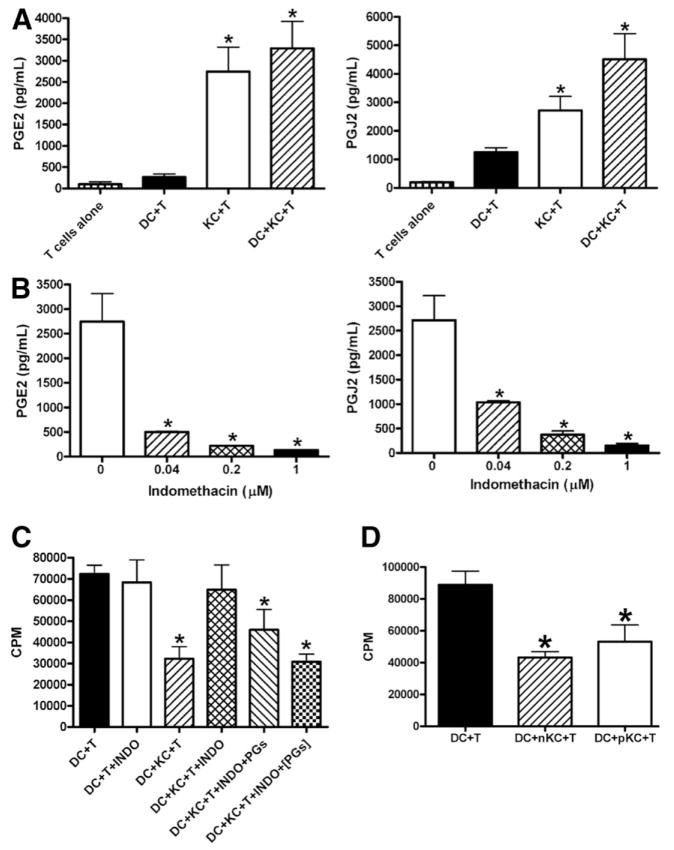
The liver is known to favor the induction of immunological tolerance rather than immunity. Although Kupffer cells (KC) have been indicated to play a role in liver tolerance to allografts and soluble antigens, the mechanisms involved remain unclear. We hypothesized that KCs could promote immune tolerance by acting as incompetent antigen-presenting cells (APC), as well as actively suppressing T cell activation induced by other potent APCs. The expression of antigen presentation-related molecules by KCs was phenotyped by flow cytometry. The abilities of KCs to act as APCs and to suppress T cell activation induced by splenic dendritic cells (DC) were examined by in vitro proliferation assays using CD4(+) OVA-TCR (ovalbumin T cell receptor) transgenic T cells. We found that, compared with DCs, KCs expressed significantly lower levels of major histocompatibility complex (MHC) II, B7-1, B7-2, and CD40. This result is consistent with our observation that KCs were not as potent as DCs in eliciting OVA-specific T cell proliferation. However, KCs isolated from polyinosinic:polycytidylic acid-treated mice expressed significantly higher levels of MHC II and costimulatory molecules than did naïve KCs and could stimulate stronger T cell responses. More importantly, we found that KCs could inhibit DC-induced OVA-specific T cell activation. Further investigation of the underlying mechanism revealed that prostaglandins produced by KCs played an important role. The results ruled out the possible involvement of interleukin-10, nitric oxide, 2,3-dioxygenase, and transforming growth factor beta in KC-mediated T cell suppression.

Conclusion: Our data indicate that KCs are a tolerogenic APC population within the liver. These findings suggest that KCs may play a critical role in regulating immune reactions within the liver and contributing to liver-mediated systemic immune tolerance. (HEPATOLOGY 2008.).


Conflict of interest statement

Potential conflict of interest: Nothing to report.

Figures

Fig. 1
Fig. 1
Phenotypical analysis of KCs in comparison with PMs and splenic DCs. (A) Liver NPCs were isolated and dual stained with anti-F4/80 and anti-CD45 antibodies. KCs were subsequently sorted by fluorescence-assisted cell sorting and used for T cell stimulation experiments. The purity of sorted KCs, indicated by the enclosed circle (CD45+F4/80+), is 96%. (B) Liver NPCs, splenocytes, and lavaged peritoneal cells were stained with various antibodies and analyzed by flow cytometry. The cells were gated on KCs (CD45+F4/80+), PMs (CD11b+F4/80+), liver DCs (CD45+CD11c+), or splenic DCs (CD45+CD11c+), and further analyzed for the expression of various surface molecules. The results are shown as histograms with fluoresce intensity on x-axis and cell number on y-axis. Solid black lines represent isotype control antibodies, and shaded histograms, specific staining. The data depicted represent three independent experiments producing similar results.
Fig. 2
Fig. 2
Comparing the abilities of KCs, PMs, and DCs to activate OVA TCR transgenic T cells. (A) CD4+ OVA-TCR transgenic T cells (5 × 10⁴/well) were incubated with DCs, PMs, or KCs (2.5 × 10⁴/well) for 3 days in the presence of various concentrations of OVA323-339. L-NMMA (0.1 mM) was included in some KC/T cell or PM/T cell cocultures. T cell proliferation was determined by [3H]-thymidine incorporation during the last 16 hours of incubation. The experiments were carried out in triplicate and the results represent mean ± standard error of the mean (SEM). *P < 0.05 compared with T cells stimulated by KCs. **P < 0.05 compared with T cells stimulated by PM. (B) CD4+ OVA-TCR transgenic T cells were labeled with CFSE, followed by incubation for 3 days with DCs or KCs in the presence of 10 μg/mL OVA323-339. Fluorescence intensities of CFSE on CD4+ T cells were measured by flow cytometry. (C) The levels of NO production in PM/T cell cocultures in the presence or absence of L-NMMA. The experiments were carried out in triplicate, and the results represent mean ± SEM. *P < 0.05 compared with cultures including L-NMMA. The data shown in panels A, B, and C represent four separate experiments producing similar results.
Fig. 3
Fig. 3
The activation status of T cells in response to stimulation by KCs and DCs. (A and B) CD4+ OVA-TCR transgenic T cells were incubated with DCs or KCs as described. (A) After 12 hours, the cells were collected and stained with anti-CD4, anti-CD25, and anti-CD69 antibodies. Results shown are flow cytometric analyses of gated CD4+ T cells. (B) After 12 hours, the supernatants were collected and IL-2 levels determined. The experiments were carried out in triplicate and the results represent mean ± SEM. *P < 0.05 compared with DC/T cell cocultures. The data shown represent two separate experiments producing similar results. (C) CD4+ T cells (2 × 10⁵/well) isolated from C57BL/6J mice were cocultured with DCs or KCs in the wells of 96-well plate pre-coated with anti-CD3 antibody (5 μg/mL). T cell proliferation was determined by [3H]-thymidine incorporation during the last 16 hours of incubation. The experiments were carried out in triplicate and the results represent mean ± SEM.
Fig. 4
Fig. 4
Poly I:C can stimulate KCs and increase their ability to activate T cells. Male C57BL/6J mice were treated by poly I:C (50 μg/mouse), or phosphate-buffered saline as control. After 12 hours, the animals were sacrificed, NPCs isolated, and KCs purified. (A) Liver NPCs were analyzed for the expression of various surface molecules. Results shown are flow cytometric analyses of gated CD45+F4/80+ KCs. The solid lines represent isotype controls, shaded histograms staining of naïve KCs, and the dotted lines staining of poly I:C-stimulated KCs. (B) CD4+ OVA-TCR transgenic T cells were incubated with either naïve or poly I:C-stimulated KCs for 3 days in the presence of various concentrations of OVA323-339. T cell proliferation was determined as described. The measurements were carried out in triplicate and the results represent mean ± SEM. *P < 0.05 compared with T cells stimulated by naïve KCs. The data shown are representative of three independent experiments producing similar results.
Fig. 5
Fig. 5
KCs inhibit splenic DC-induced expansion of OVA-TCR transgenic T cells. (A) CD4+ OVA-TCR transgenic T cells (5 × 10⁴/well) were incubated with 2.5 × 10⁴/well DCs, KCs, or DCs plus KCs (1:1 ratio) for 3 days in the presence of 10 μg/mL OVA323-339. T cell proliferation was determined by [3H]-thymidine incorporation during the last 16 hours of incubation. The experiments were carried out in triplicate and the results represent mean ± SEM. *P < 0.05 compared with T cells stimulated by DCs alone. (B) CD4+ OVA-TCR transgenic T cells were labeled with CFSE, followed by incubation with DCs alone, or in the presence of KCs with or without separation by a transwell membrane. OVA323-339 (10 μg/mL) were included in all cultures, and after 3 days the cells analyzed for CFSE staining on CD4+ T cells. The data shown in A and B are representative of four independent experiments producing similar results.
Fig. 6
Fig. 6
KC-induced T cell suppression was not mediated by NO, IDO, IL-10, or TGF-β. CD4+ OVA-TCR transgenic T cells were incubated with DCs or the combination of DCs and KCs as described. L-NMMA (0.1 mM), 1-MT (1 mM), anti–IL-10 (10 μg/mL), or anti–TGF-β (10 μg/mL) neutralizing antibody was included in some DC/KC/T cell cocultures. T cell proliferation was determined after 3 days as described. The experiments were carried out in triplicate, and the results represent mean ± SEM. *P < 0.05 compared with T cells stimulated by DCs alone. Similar results were obtained in four separate experiments conducted in the same manner.
Fig. 7
Fig. 7
KC-induced T cell suppression was mediated by PGs. (A) CD4+ OVA-TCR transgenic T cells were cultured alone, or in the presence of DCs, KCs, or DCs and KCs. After 48 hours, the supernatants were collected and the levels of PGE2 and 15d-PGJ2 were determined. The measurements were carried out in triplicate and the results represent mean ± SEM. *P < 0.05 compared with T cells alone. (B) KCs (2.5 × 10⁴/well) were cultured in the absence and presence of various concentrations of indomethacin. After 48 hours, the supernatants were collected and the levels of PGE2 and PGJ2 measured. The measurements were carried out in triplicate and the results represent mean ± SEM. *P < 0.05 compared with KCs cultured in the absence of indomethacin. (C) DCs (2.5 × 10⁴/well) and KCs (2.5 × 10⁴/well) were cultured overnight before the addition of CD4+ OVA-TCR transgenic T cells (5 × 10⁴/well). Indomethacin (INDO, 1 μM) was included in some DC/KC overnight cocultures. Furthermore, a combination of exogenous PGE2 (3 ng/mL) and PGJ2 (3 ng/mL) wad added either in DC/KC overnight cultures, or in DC/KC/T cell cocultures at the same time as the addition of T cells (PGs). T cell proliferation was determined after 3 days as described. (D) CD4+ OVA-TCR transgenic T cells were incubated with DCs alone, or in the presence of naïve KCs (nKC) or KCs isolated from poly I:C-treated mice (pKC). T cell proliferation was determined after 3 days as described. (C and D) The measurements were carried out in triplicate and the results represent mean ± SEM. *P < 0.05 compared with T cells stimulated by DCs. The data shown in panels A, B, C, and D represent four independent experiments producing similar results.

References

    1. Calne RY, Sells RA, Pena JR, et al. Induction of immunological tolerance by porcine liver allografts. Nature. 1969;223:472–476. - PubMed
    1. Gorczynski RM, Chan Z, Chung S, Cohen Z, Levy G, Sullivan B, et al. Prolongation of rat small bowel or renal allograft survival by pretransplant transfusion and/or by varying the route of allograft venous drainage. Transplantation. 1994;58:816–820. - PubMed
    1. Rao VK, Burris DE, Gruel SM, Sollinger HW, Burlingham WJ. Evidence that donor spleen cells administered through the portal vein prolong the survival of cardiac allografts in rats. Transplantation. 1988;45:1145–1146. - PubMed
    1. Cantor HM, Dumont AE. Hepatic suppression of sensitization to antigen absorbed into the portal system. Nature. 1967;215:744–745. - PubMed
    1. Chen Y, Ong CR, McKenna GJ, Mui AL, Smith RM, Chung SW. Induction of immune hyporesponsiveness after portal vein immunization with ovalbumin. Surgery. 2001;129:66–75. - PubMed

Publication types

MeSH terms