

Differential regulation of Listeria monocytogenes internalin and internalin-like genes by sigmaB and PrfA as revealed by subgenomic microarray analyses
- PMID: 18713061
- PMCID: PMC2688707
- DOI: 10.1089/fpd.2008.0085
Differential regulation of Listeria monocytogenes internalin and internalin-like genes by sigmaB and PrfA as revealed by subgenomic microarray analyses
Abstract
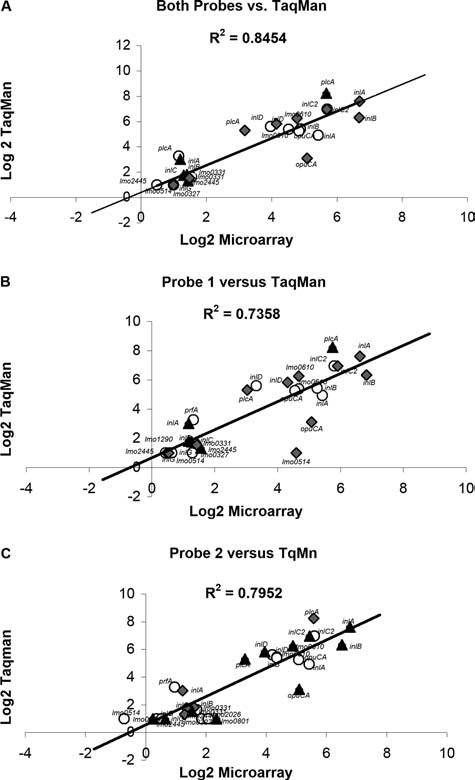
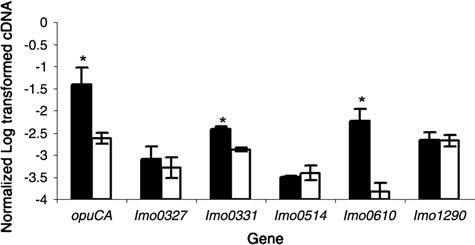
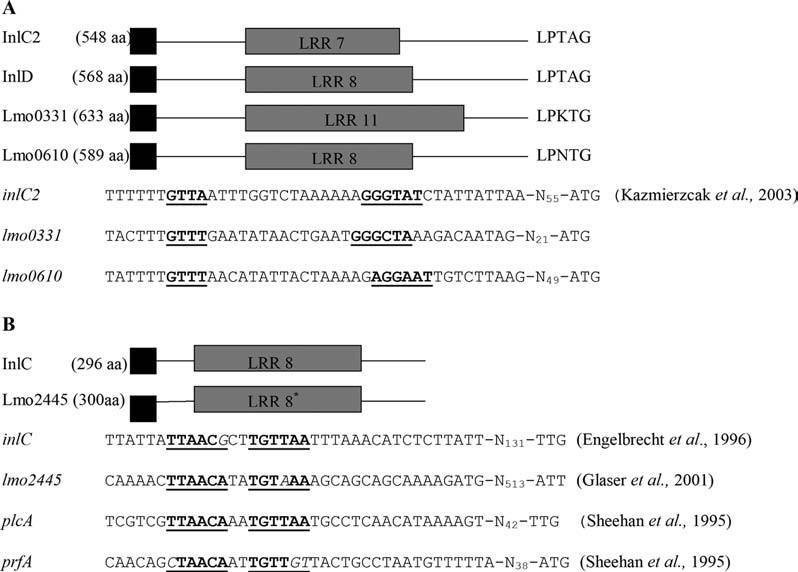
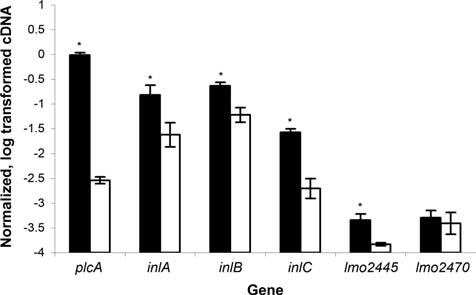
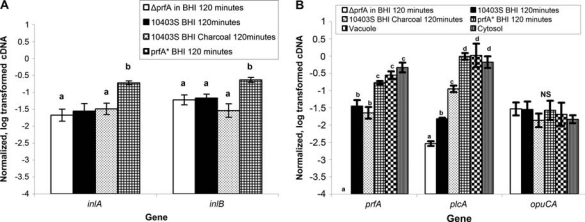
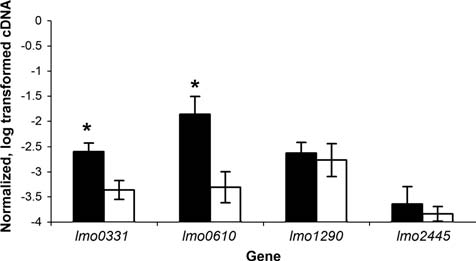
The Listeria monocytogenes genome contains more than 20 genes that encode cell surface-associated internalins. To determine the contributions of the alternative sigma factor sigma(B) and the virulence gene regulator PrfA to internalin gene expression, a subgenomic microarray was designed to contain two probes for each of 24 internalin-like genes identified in the L. monocytogenes 10403S genome. Competitive microarray hybridization was performed on RNA extracted from (i) the 10403S parent strain and an isogenic Delta sigB strain; (ii) 10403S and an isogenic Delta prfA strain; (iii) a (G155S) 10403S derivative that expresses the constitutively active PrfA (PrfA*) and the Delta prfA strain; and (iv) 10403S and an isogenic Delta sigB Delta prfA strain. Sigma(B)- and PrfA-dependent transcription of selected genes was further confirmed by quantitative reverse-transcriptase polymerase chain reaction. For the 24 internalin-like genes examined, (i) both sigma(B) and PrfA contributed to transcription of inlA and inlB, (ii) only sigma(B) contributed to transcription of inlC2, inlD, lmo0331, and lmo0610; (iii) only PrfA contributed to transcription of inlC and lmo2445; and (iv) neither sigma(B) nor PrfA contributed to transcription of the remaining 16 internalin-like genes under the conditions tested.
Figures
Similar articles
-
The alternative sigma factor sigma B and the virulence gene regulator PrfA both regulate transcription of Listeria monocytogenes internalins.Appl Environ Microbiol. 2007 May;73(9):2919-30. doi: 10.1128/AEM.02664-06. Epub 2007 Mar 2. Appl Environ Microbiol. 2007. PMID: 17337550 Free PMC article.
-
Temperature-dependent expression of Listeria monocytogenes internalin and internalin-like genes suggests functional diversity of these proteins among the listeriae.Appl Environ Microbiol. 2007 May;73(9):2806-14. doi: 10.1128/AEM.02923-06. Epub 2007 Mar 2. Appl Environ Microbiol. 2007. PMID: 17337561 Free PMC article.
-
SigmaB- and PrfA-dependent transcription of genes previously classified as putative constituents of the Listeria monocytogenes PrfA regulon.Foodborne Pathog Dis. 2008 Jun;5(3):281-93. doi: 10.1089/fpd.2008.0079. Foodborne Pathog Dis. 2008. PMID: 18564909 Free PMC article.
-
Cross Talk between SigB and PrfA in Listeria monocytogenes Facilitates Transitions between Extra- and Intracellular Environments.Microbiol Mol Biol Rev. 2019 Sep 4;83(4):e00034-19. doi: 10.1128/MMBR.00034-19. Print 2019 Nov 20. Microbiol Mol Biol Rev. 2019. PMID: 31484692 Free PMC article. Review.
-
Flick of a switch: regulatory mechanisms allowing Listeria monocytogenes to transition from a saprophyte to a killer.Microbiology (Reading). 2019 Aug;165(8):819-833. doi: 10.1099/mic.0.000808. Epub 2019 May 20. Microbiology (Reading). 2019. PMID: 31107205 Review.
Cited by
-
Chitinase Expression in Listeria monocytogenes Is Influenced by lmo0327, Which Encodes an Internalin-Like Protein.Appl Environ Microbiol. 2017 Oct 31;83(22):e01283-17. doi: 10.1128/AEM.01283-17. Print 2017 Nov 15. Appl Environ Microbiol. 2017. PMID: 28887418 Free PMC article.
-
The stress-induced virulence protein InlH controls interleukin-6 production during murine listeriosis.Infect Immun. 2010 May;78(5):1979-89. doi: 10.1128/IAI.01096-09. Epub 2010 Feb 22. Infect Immun. 2010. PMID: 20176794 Free PMC article.
-
Differential Modulation of Listeria monocytogenes Fitness, In Vitro Virulence, and Transcription of Virulence-Associated Genes in Response to the Presence of Different Microorganisms.Appl Environ Microbiol. 2020 Aug 18;86(17):e01165-20. doi: 10.1128/AEM.01165-20. Print 2020 Aug 18. Appl Environ Microbiol. 2020. PMID: 32591377 Free PMC article.
-
Systems Level Analyses Reveal Multiple Regulatory Activities of CodY Controlling Metabolism, Motility and Virulence in Listeria monocytogenes.PLoS Genet. 2016 Feb 19;12(2):e1005870. doi: 10.1371/journal.pgen.1005870. eCollection 2016 Feb. PLoS Genet. 2016. PMID: 26895237 Free PMC article.
-
Use of omics methods for the advancement of food quality and food safety.Anim Front. 2018 Nov 9;8(4):33-41. doi: 10.1093/af/vfy024. eCollection 2018 Oct. Anim Front. 2018. PMID: 32002228 Free PMC article. No abstract available.
References
-
- Anonymous. Listeria monocytogenes Sequencing Project. Broad Institute of Harvard and Massachusetts Institute of Technology 2006. 2007. http://www.broad.mit.edu/annotation/genome/listeria_group/MultiHome.html. [Jul 4;2008 ]. http://www.broad.mit.edu/annotation/genome/listeria_group/MultiHome.html
-
- Bakardjiev AI. Stacy BA. Portnoy DA. Growth of Listeria monocytogenes in the guinea pig placenta and role of cell-to-cell spread in fetal infection. J. Infect. Dis. 2005;191:1889–1897. - PubMed
-
- Bakardjiev AI. Theriot JA. Portnoy DA. Listeria monocytogenes traffics from maternal organs to the placenta and back. Available at http://www.plospathogens.org/ PLoS Pathog. 2006;2:e66. - PMC - PubMed
Publication types
MeSH terms
Substances
Grants and funding
LinkOut - more resources
Full Text Sources
Other Literature Sources
Molecular Biology Databases