Review
. 2008 Aug;5(4):487-97.
doi: 10.1089/fpd.2008.0117.

Methods and tools for comparative genomics of foodborne pathogens

Affiliations
Review

Methods and tools for comparative genomics of foodborne pathogens

Arvind A Bhagwat et al. Foodborne Pathog Dis. 2008 Aug.

Abstract

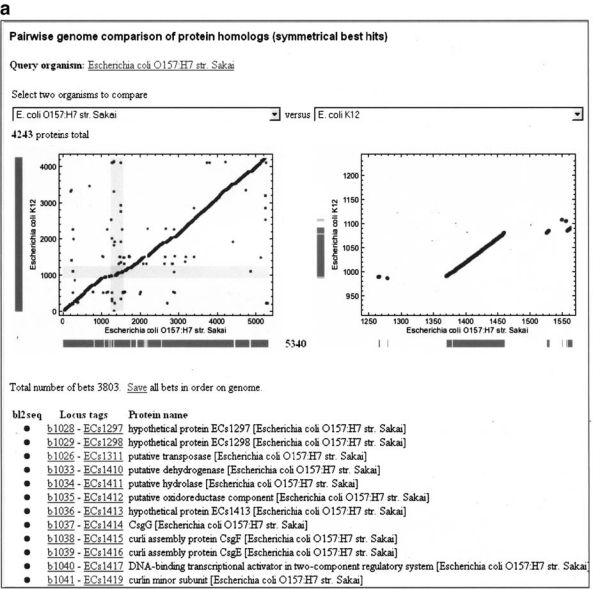
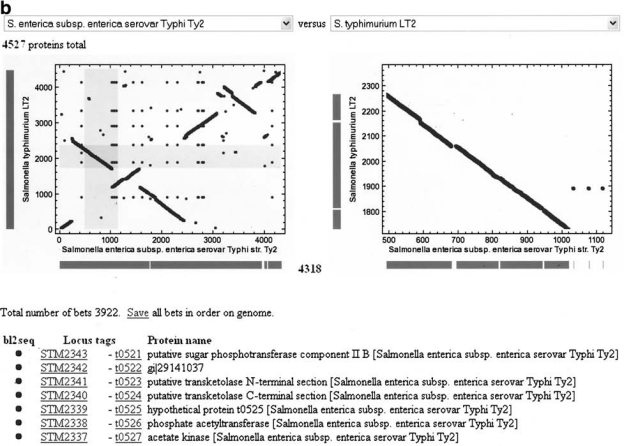
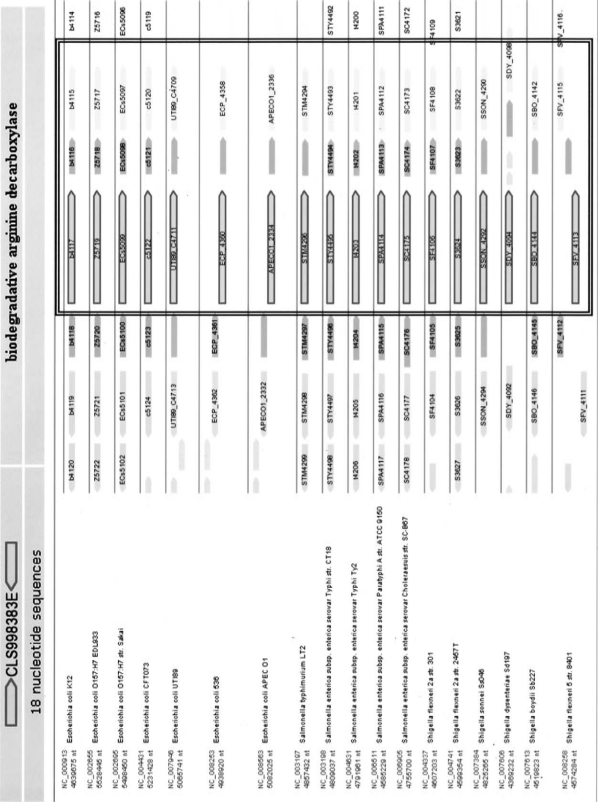
A comparison of genome sequences and of encoded proteins with the database of existing annotated sequences is a useful approach to understand the information at the genome level. Here we demonstrate the utility of several DNA and protein sequence comparison tools to interpret the information obtained from several genome projects. Comparisons are presented between closely related strains of Escherichia coli commensal isolates, different isolates of O157:H7, and Shigella spp. It is expected that comparative genome analysis will generate a wealth of data to compare pathogenic isolates with varying levels of pathogenicity, which in turn may reveal mechanisms by which the pathogen may adapt to a particular nutrient supply in certain foods. These genome sequence analysis tools will strengthen foodborne pathogen surveillance and subsequent risk assessment to enhance the safety of the food supply.


Figures

FIG. 1.
FIG. 1.
Pairwise genome comparisons of protein homologs of Escherichia coli strains K-12 (MG1665) (NC_000913.2) and O157:H7 Sakai (NC_002695.1) (a) and Salmonella enterica serovar Typhimurium LT2 (NC_003197.1) and Typhi Ty2 (NC_004631.1) (b). The comparisons were generated using GenePlot with precalculated BLAST results for each genome. (a) The mutual best hits from E. coli K-12 genome (4243 proteins) are plotted on y-axis against 5340 proteins from O157:H7 (x-axis) in the order of genes on the genome. The region indicated by gray cross hair is zoomed in the panel on the right side, and the proteins in this region are listed below. The columns in this table are K-12 gene identifiers bxxxx, Sakai identifiers ECsxxxx, and Sakai protein name. (b) GenePlot for Salmonella enterica serovar Typhimurium LT2 (4527 proteins; y-axis) and Typhi Ty2 (4318 proteins; x-axis). The region indicated by gray cross hair is zoomed in the panel on the right side, and the proteins in this region are listed below. The columns in this table are LT2 gene identifiers STMxxxx, Ty2 identifiers txxxx, and Ty2 protein name. As a result of inversion in this region (plasticity zone), the locus_tags order in Ty2 is increasing (t0521 to t0527), while decreasing locus_tags order is seen for LT2 (STM2343 to STM2337).
FIG. 1.
FIG. 1.
Pairwise genome comparisons of protein homologs of Escherichia coli strains K-12 (MG1665) (NC_000913.2) and O157:H7 Sakai (NC_002695.1) (a) and Salmonella enterica serovar Typhimurium LT2 (NC_003197.1) and Typhi Ty2 (NC_004631.1) (b). The comparisons were generated using GenePlot with precalculated BLAST results for each genome. (a) The mutual best hits from E. coli K-12 genome (4243 proteins) are plotted on y-axis against 5340 proteins from O157:H7 (x-axis) in the order of genes on the genome. The region indicated by gray cross hair is zoomed in the panel on the right side, and the proteins in this region are listed below. The columns in this table are K-12 gene identifiers bxxxx, Sakai identifiers ECsxxxx, and Sakai protein name. (b) GenePlot for Salmonella enterica serovar Typhimurium LT2 (4527 proteins; y-axis) and Typhi Ty2 (4318 proteins; x-axis). The region indicated by gray cross hair is zoomed in the panel on the right side, and the proteins in this region are listed below. The columns in this table are LT2 gene identifiers STMxxxx, Ty2 identifiers txxxx, and Ty2 protein name. As a result of inversion in this region (plasticity zone), the locus_tags order in Ty2 is increasing (t0521 to t0527), while decreasing locus_tags order is seen for LT2 (STM2343 to STM2337).
FIG. 2.
FIG. 2.
Three-way protein homology-based comparisons of Escherichia coli strains using TaxPlot. (a) BLAST scores of E. coli O157:H7 Sakai strain compared with K-12 (y-axis) and O157:H7 EDL 933 (NC_002655.2) (x-axis). The O157:H7 Sakai proteins equally similar to the K-12 and O157:H7 EDL 933 proteins are plotted along the diagonal. Sakai proteins that are asymmetrically similar to EDL 933 appear off the diagonal. The Sakai protein most similar to EDL proteins is indicated by gray circle and that region is zoomed in the right hand-side panel. The RefSeq accession number of these proteins and their description, and similarity information to K-12 and EDL 933 proteins are listed below. The hypothetical Sakai protein (ECs0542) is more similar to EDL 933 compared to K-12 (BLAST similarity scores 22,114 vs. 401, respectively). (b) BLAST scores of E. coli commensal strain HS (NC_009800.1) are compared with K-12 (y-axis) and O157:H7 EDL 933 (x-axis). The HS proteins equally similar to the K-12 and O157:H7 EDL 933 proteins are plotted along the diagonal. One of the HS proteins more similar to the EDL protein is indicated by gray circle and that region is zoomed in the right hand-side panel. The RefSeq accession number of this protein and its description, and similarity information to K-12 and EDL 933 proteins are listed below (BLAST similarity scores of 6837 vs. 1573, respectively).
FIG. 3.
FIG. 3.
Taxonomic distribution of proteins from Escherichia coli strains O157:H7 Sakai (left panel) and K-12 (right panel) using TaxMap. Taxonomic distribution of Sakai protein homologs excluding similarity to E. coli is shown. Each circle indicates a protein as in the order of the gene on the genome. Various shades indicate the taxonomic lineages of the most similar protein to each protein from bacteria, archaea, viruses, and eukaryotes. One region in the left panel that includes a stretch of gray circles, indicating similarity to viral proteins, is highlighted and the table below lists the similarity information. The columns are Sakai protein identifier, identifier of the most similar viral protein and BLAST score, identifier of the most similar eukaryotic protein and BLAST score, identifier of the most similar eubacterial protein and BLAST score, identifier of the most similar archeal protein identifier and BLAST score, and Sakai protein name.
FIG. 4.
FIG. 4.
Protein cluster (CLS 998383) comparison of 20-kbp region flanking biodegradative arginine decarboxylase. Three genes responsible for arginine-dependent acid-resistance pathway are boxed. Arginine decarboxylase followed by two downstream ORFs, putative arginine decarboxylase regulator, and arginine-agamatin transporter are shown.

Similar articles

Cited by

References

    1. Abe K. Saito N. Kasuga F, et al. Prolonged incubation period of salmonellosis associated with low bacterial doses. J. Food Prot. 2004;67:2735–2740. - PubMed
    1. Agle ME. Martin SE. Blaschek HP. Survival of Shigella boydii 18 in bean salad. J. Food Prot. 2005;68:838–840. - PubMed
    1. Allos BM. Moore MR. Griffin PM, et al. Surveillance for sporadic foodborne disease in the 21st century: the FoodNet perspective. Clin. Infect. Dis. 2004;38(Suppl 3):S115–S120. - PubMed
    1. Altschul SF. Gish W. Miller W, et al. Basic local alignment search tool. J. Mol. Biol. 1990;215:403–410. - PubMed
    1. Bhagwat AA. Microbiological safety of fresh-cut produce: where are we now? In: Matthews KR, editor. Microbiology of Fresh Produce. Washington, DC: American Society for Microbiology; 2006. pp. 121–165.

LinkOut - more resources