. 2008 Oct;70(2):341-51.
doi: 10.1111/j.1365-2958.2008.06408.x. Epub 2008 Aug 18.

The final step in the phage infection cycle: the Rz and Rz1 lysis proteins link the inner and outer membranes

Affiliations

The final step in the phage infection cycle: the Rz and Rz1 lysis proteins link the inner and outer membranes

Joel Berry et al. Mol Microbiol. 2008 Oct.

Abstract

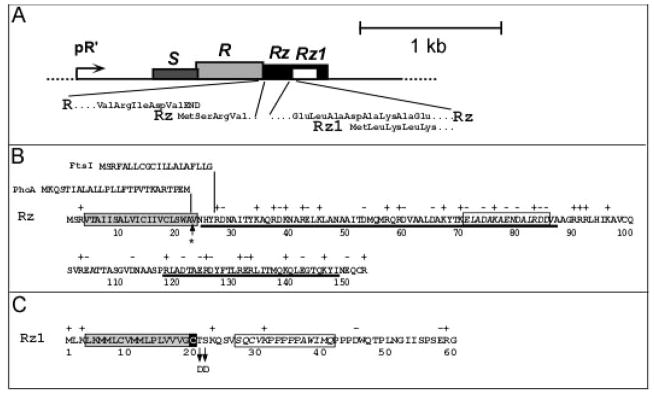
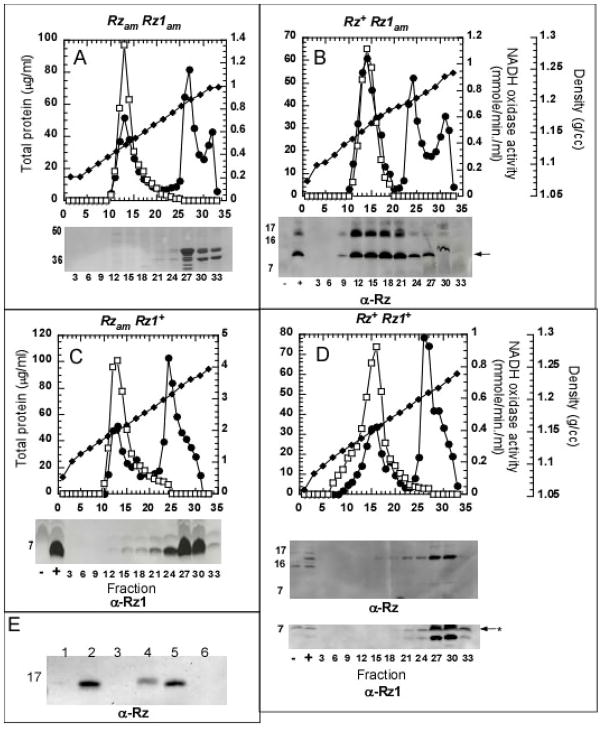
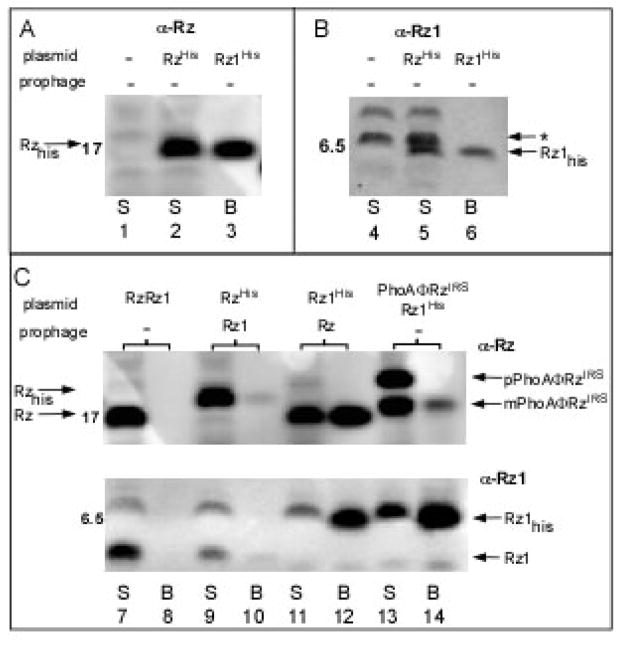
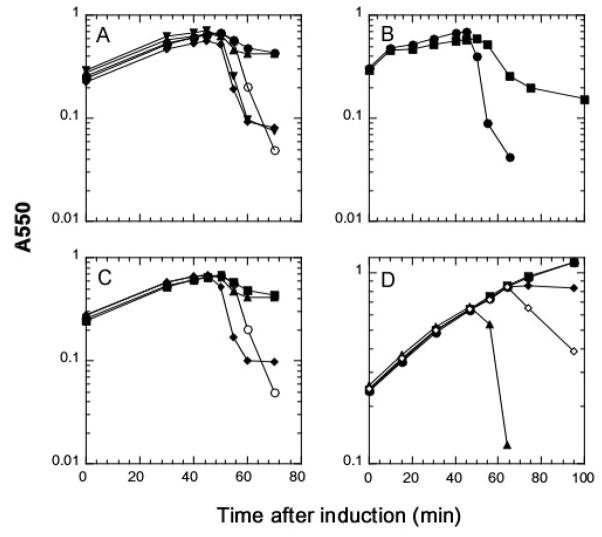
Bacteriophage lambda has four adjacent genes -S, R, Rz and Rz1- dedicated to host cell lysis. While S, encoding the holin and antiholin, and R, encoding the endolysin, have been intensively studied, the products of Rz and Rz1 have not been characterized at either the structural or functional levels. Rz1 is an outer membrane lipoprotein and our results indicate that Rz is a type II signal anchor protein. Here we present evidence that an Rz-Rz1 complex that spans the periplasm carries out the final step in the process of host lysis. These results are discussed in terms of a model where endolysin-mediated degradation of the cell wall is a prerequisite for conformational changes in the Rz-Rz1 complex leading to the juxtaposition and fusion of the IM and OM. Fusion of the two membranes removes the last physical barrier to efficient release of progeny virions.


Figures

Figure 1
Figure 1. The Rz/Rz1 genes
A. The lambda lysis cassette. The four lysis genes are shown drawn to scale downstream of the lambda late promoter, pR′. The insets show the initial codons of Rz, beginning at the end of the R endolysin gene, and Rz1, which is embedded entirely within Rz in the +1 reading frame. Modified with permission from Summer et al. (2007). B. Rz amino acid sequence. The TMD is boxed in gray and predicted alpha-helical regions are underlined. Above the Rz sequence, the sequences of the PhoA secretory signal and the FtsI N-terminal TMD are shown above the junctions where they are substituted in the PhoA-Rz and FtsI-Rz hybrid constructs. The asterisk indicates the position of a predicted signal peptidase I cleavage site (Bendtsen et al., 2004). The boxed italic text here and in panel C indicates the polypeptide sequence used for raising antibodies. C. Rz1 amino acid sequence. The lipoprotein (signal peptidase II) signal sequence predicted by LipoP (Juncker et al., 2003) is boxed in gray, with the processed Cys residue highlighted in black. The positions of the two Asp substitutions that redirect Rz1 to the cytoplasmic membrane are indicated by arrows.
Figure 2
Figure 2. The subcellular localization of Rz and Rz1 at physiological levels of expression
Panels A – E: Membranes from an induced culture of RY17299 carrying isogenic λ901 prophages with the indicated RzRz1 alleles were analyzed by (Panels A – D) sucrose density gradient or by carbonate extraction (Panel E), as described in Materials and Methods. Symbols: total protein, filled circles; NADH oxidase activity, open boxes; density, filled diamonds. In all cases, the abscissa of the gradient distributions and gel or immunoblot insets is sample number, from the top of the gradient. Panel A: Coomassie-blue stained SDS gel showing major OMPs distributed in fractions 27–33. Panels B and D: representative fractions immunoblotted with anti-Rz antibody, with selected MW standards indicated to the left. +, −: total membrane samples from induced lysogens with wt (+) or null (−) Rz or Rz1 genes, as indicated. Arrow in panel B indicates the position of putative Rz degradation product (see text). Panel D also has an immunoblot using anti-Rz1 with the postion of a reproducible background band indicated by an asterisk. Lanes in Panel E: 1, soluble fraction from French-press disrupted cells; 2, total membrane fraction from disrupted cells; 3, soluble fraction from carbonate extraction; 4, insoluble fraction from carbonate extraction; 5, soluble fraction from 1% EBB extraction; 6, fraction insoluble in 1% EBB.
Figure 3
Figure 3. Rz and Rz1 form a complex
Induced RY17299 lysogens carrying single isogenic λ901 prophages and plasmids carrying various Rz and Rz1 alleles were converted to spheroplasts, lysed, and subjected to batch affinity fractionation with magnetic Talon beads. The Rz or Rz1 proteins present in each case are shown above each lane. Total spheroplasts (S) and proteins bound to the beads (B) were analyzed by SDS-PAGE and Western blotting with the antibodies indicated above (panels A,B) or to the side (panel C) of each panel. Panels A and B: Lanes 1 and 4, RzamRz1am lysogen with pRE; Lanes 2 and 3, RzamRz1am lysogen with pRE-RzHIS; Lanes 5 and 6, RzamRz1am lysogen with pRE-Rz1HIS; Panel C; Lanes 7 and 8, RzamRz1am lysogen with pRE-RzRz1; Lanes 9 and 10, RzamRz1 lysogen with pRE-RzHIS; Lanes 11 and 12, RzRz1am lysogen with pRE-Rz1HIS; Lanes 13 and 14, RzamRz1am lysogen with pRE-PhoAΦRzIRSRz1HIS. The position of relevant MW standards is indicated on the left of each panel. An asterisk indicates the position of a reproducible background band. The bands representing Rz, RzHIS, Rz1, Rz1HIS as well as mature (mPhoAΦRzIRS) and precursor (pPhoAΦRzIRS) forms of the PhoA-Rz chimera are indicated with arrows.
Figure 4
Figure 4. Rz1 function requires its OM localization signal
Growth of the indicated cultures after lysogenic (Panels A, B, C) and/or IPTG (Panels B, D) induction was monitored as described in Materials and Methods. In all panels, the open symbols indicate standard LB media while the filled symbols indicate LB supplemented with 10 mM MgCl2. Panel A: MC4100(λ900RzamRz1+) carrying pRE(○, ●); pRE-RzIRS (▼); pRE-PhoAΦRzIRS (▲); pRE-FtsIΦRzIRS (◆). Panel B: MC4100(λ900) carrying pJF118EH (●), pJF-PhoAΦRzIRS (■). Panel C: MC4100(λ900Rz+Rz1am) carrying pRE (○,■); pRE-Rz1AU1 (◆); pRE-Rz1AU1T21D,S22D (▲). Panel D: RY17299lacIQ carrying pRW (●); pRE-RzRz1 (■); pRW-LyzC13S,C44S (◇, ◆); pRW-RzRz1-LyzC13S,C44S (▲).
Figure 5
Figure 5. The non-functional Rz1Au1T21DS22D mutant localizes to the inner membrane
Membranes from induced RY17299(λ901RzamRz1am) cells carrying the plasmid pRE-Rz1AU1T21D,S22D were analyzed by sucrose gradient and immunoblot, as described for Figure 1.

References

    1. Bartel PL, Roecklein JA, SenGupta D, Fields S. A protein linkage map of Escherichia coli bacteriophage T7. Nat Genet. 1996;12:72–77. - PubMed
    1. Bendtsen JD, Nielsen H, von Heijne G, Brunak S. Improved prediction of signal peptides: SignalP 3.0. J Mol Biol. 2004;340:783–795. - PubMed
    1. Bernhardt TG, Roof WD, Young R. The Escherichia coli FKBP-type PPIase SlyD is required for the stabilization of the E lysis protein of bacteriophage ϕX174. Mol Microbiol. 2002;45:99–108. - PubMed
    1. Bienkowska-Szewczyk K, Taylor A. Murein transglycosylase from phage λ lysate: purification and properties. Biochim Biophys Acta. 1980;615:489–496. - PubMed
    1. Birdsell DC, Cota-Robles EH. Production and ultrastructure of lysozyme and ethylenediaminetetraacetate-lysozyme spheroplasts of Escherichia coli. J Bacteriol. 1967;93:427–437. - PMC - PubMed

Publication types

Substances