. 2008 Oct 17;283(42):28480-6.
doi: 10.1074/jbc.M800039200. Epub 2008 Aug 18.

Ecto-nucleoside triphosphate diphosphohydrolase 1 (E-NTPDase1/CD39) regulates neutrophil chemotaxis by hydrolyzing released ATP to adenosine

Affiliations

Ecto-nucleoside triphosphate diphosphohydrolase 1 (E-NTPDase1/CD39) regulates neutrophil chemotaxis by hydrolyzing released ATP to adenosine

Ross Corriden et al. J Biol Chem. .

Abstract

Polymorphonuclear neutrophils release ATP in response to stimulation by chemoattractants, such as the peptide N-formyl-methionyl-leucyl-phenylalanine. Released ATP and the hydrolytic product adenosine regulate chemotaxis of neutrophils by sequentially activating purinergic nucleotide and adenosine receptors, respectively. Here we show that that ecto-nucleoside triphosphate diphosphohydrolase 1 (E-NTPDase1, CD39) is a critical enzyme for hydrolysis of released ATP by neutrophils and for cell migration in response to multiple agonists (N-formyl-methionyl-leucyl-phenylalanine, interleukin-8, and C5a). Upon stimulation of human neutrophils or differentiated HL-60 cells in a chemotactic gradient, E-NTPDase1 tightly associates with the leading edge of polarized cells during chemotaxis. Inhibition of E-NTPDase1 reduces the migration speed of neutrophils but not their ability to detect the orientation of the gradient field. Studies of neutrophils from E-NTPDase1 knock-out mice reveal similar impairments of chemotaxis in vitro and in vivo. Thus, E-NTPDase1 plays an important role in regulating neutrophil chemotaxis by facilitating the hydrolysis of extracellular ATP.


Figures
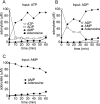
FIGURE 1.
FIGURE 1.
Hydrolysis of nucleotides by human PMN. ATP (A), ADP (B), and AMP (C) were added at final concentrations of 100 μm to a suspension of PMN in HBSS (0.25 ml; 2 × 10⁷ PMN/ml). ATP and its hydrolytic products were measured by HPLC analysis after incubation at 37 °C for the indicated periods. The data shown are representative of results obtained in 3 separate experiments for each nucleotide.
FIGURE 2.
FIGURE 2.
Quantification of mRNA levels of ecto-nucleotidases in PMN and HL-60 cells. Real-time PCR was used to assess mRNA expression levels (relative to 18 S RNA) of ecto-nucleotidases in PMN and differentiated HL-60 cells. E-NTPDase8 and ENPP3, ENPP4, and ENPP5 were not detected in either cell type. The data shown are mean ± S.D. for results obtained in 3 separate experiments.
FIGURE 3.
FIGURE 3.
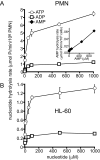
Kinetics of nucleotide hydrolysis by PMN and HL-60 cells. Varying concentrations of ATP, ADP, and AMP were incubated with 106 PMN/ml (A) or 106 HL-60 cells/ml (B), and inorganic phosphate production was assayed as indicated under “Experimental Procedures.” The initial reaction velocity of nucleotide hydrolysis was measured for each concentration. Data under “Results” for Km and Vmax were derived by Lineweaver-Burk analysis. AMP hydrolysis by PMN is shown in panel A in the inset. Data for AMP hydrolysis by HL-60 cells are not shown because such hydrolysis occurred at too low a rate to be detected. The data shown represent mean ± S.D. for 3 separate experiments.
FIGURE 4.
FIGURE 4.
Inhibitors of E-NTPDase1 decrease nucleotide hydrolysis by PMN. PMN (106/ml in HBSS) were incubated at 37 °C for 15 min with increasing concentrations of NaN3, an inhibitor of E-NTPDase1 (A), or ARL67156, an inhibitor of E-NTPDase1 and E-NTPDase3 (B). Hydrolysis of 100 μm of the indicated nucleotides was assessed after a further 10 min using the malachite green assay. The data shown represent mean ± S.D. for 3 separate experiments.
FIGURE 5.
FIGURE 5.
Inhibitors of E-NTPDase1 decrease PMN chemotaxis. A, PMN (1 × 10⁴) were placed on fibronectin-coated coverslips in a microincubation chamber containing 1 ml of HBSS at 37 °C. Migration toward a point source of fMLP (100 nm) was monitored over 4 min using an inverted microscope, as described previously (8). Inhibitors of E-NTPDase1 (ARL67156 or NaN3) were added to the cells 10 min before generation of the chemotactic gradient. The paths of individual cells migrating in the gradient field are plotted such that the y axis represents the straight-line paths from each cell origin to the point source of fMLP. Chemotactic patterns of control PMN (fMLP only) and PMN treated with ARL67156 (100 μm) or NaN3 (10 mm) are shown. The data are representative of 3 separate experiments. B, the potent E-NTPDase inhibitor sodium metatungstate (POM1) suppressed PMN chemotaxis induced by fMLP. Different concentrations of POM1 were added in the top and bottom wells of a Transwell assay system, and chemotaxis was determined as described above. C, PMN (1 × 10⁶), in the presence or absence of ARL67156 (100 μm), were placed in the top well of a Transwell system, with the bottom wells containing fMLP (10 nm), IL-8 (10 ng/ml), or C5a (10% zymosan-activated serum). After 30 min at 37 °C, cells in the lower well were lysed, and relative migration levels were quantified by measuring elastase activity. The data shown (mean ± S.E.) were obtained in 3–4 separate experiments. Statistical differences between untreated and cells treated with ARL67156 were evaluated using the Student's t test (*, p < 0.001, **, p < 0.01).
FIGURE 6.
FIGURE 6.
Localization of E-NTPDase1 in migrating PMN and HL-60 cells. PMN or differentiated HL-60 cells were plated on glass coverslips, stimulated with 10 nm fMLP, fixed with paraformaldehyde, and stained using a murine antibody to E-NTPDase1 followed by a fluorescent secondary goat anti-mouse antibody. The top and middle panels show bright field and fluorescent images, respectively. The bottom panels show pixel intensity diagrams of fluorescence along the length of cells. Gray dashed lines indicate the start and endpoints of the fluorescence intensity diagrams and represent the leading edge and uropod/back end of cells, respectively (RFU, relative fluorescence units). The results shown are representative of findings from 3 separate experiments obtained in at least 50 PMN or HL-60 cells and indicate that maximal fluorescence is present at the leading edge.
FIGURE 7.
FIGURE 7.
Migration of PMN from E-NTPDase1 knock-out mice. A, in vivo PMN migration was assessed by determining the influx of leukocytes in the abdominal cavity of WT and E-NTPDase1 knock-out mice in response to intraperitoneal injection of 1 nm W-peptide solution or normal saline as control. B, the chemotactic properties of PMN from the bone marrow of WT or E-NTPDase1 knock-out mice in a gradient of W-peptide generated as described in the legend for Fig. 5 were assessed under the microscope using the methods described previously (8). The results shown are the mean ± S.D. of the results obtained with 3–6 different animals in each group.
FIGURE 8.
FIGURE 8.
Proposed mechanism of ATP release, action and hydrolysis by PMN. Chemoattractant stimulation of PMN causes the release of ATP at the leading edge. Released ATP activates P2Y2 receptors, which stimulates chemokinesis, or is hydrolyzed by E-NTPDase1, also localized at the leading edge. An additional enzyme, possibly ALP in human PMN, hydrolyzes extracellular AMP to adenosine, which activates A3 adenosine receptors at the leading edge and promotes cell migration toward the chemotactic source.

References

    1. Burnstock, G. (2006) Br. J. Pharmacol. 147 Suppl. 1, S172-S181 - PMC - PubMed
    1. North, R. A., and Verkhratsky, A. (2006) Pfluegers Arch. Eur. J. Physiol. 452 479-485 - PubMed
    1. Schwiebert, E. M., and Zsembery, A. (2003) Biochim. Biophys. Acta 1615 7-32 - PubMed
    1. Fredholm, B. B. (1997) Gen. Pharmacol. 28 345-350 - PubMed
    1. Robson, S. C., Sévigny, J., and Zimmermann, H. (2006) Purinergic Signal. 2 409-430 - PMC - PubMed

Publication types