. 2008 Aug 26;105(34):12365-9.
doi: 10.1073/pnas.0803032105. Epub 2008 Aug 19.

Evolution exacerbates the paradox of the plankton

Affiliations

Evolution exacerbates the paradox of the plankton

Noam Shoresh et al. Proc Natl Acad Sci U S A. .

Abstract

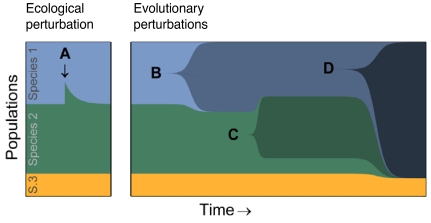
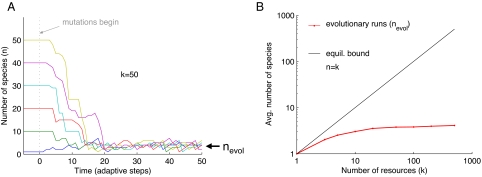
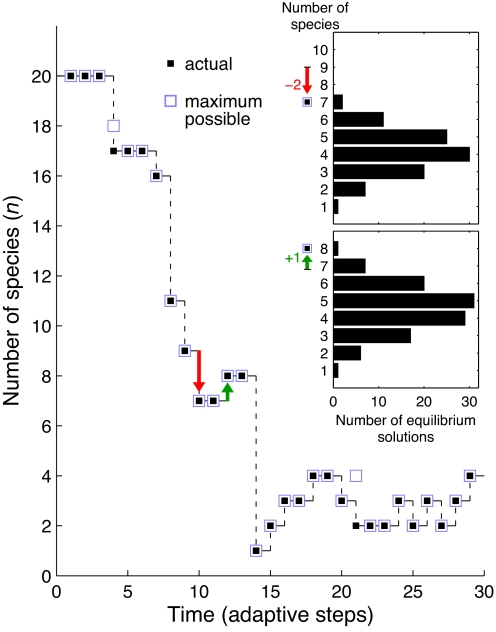
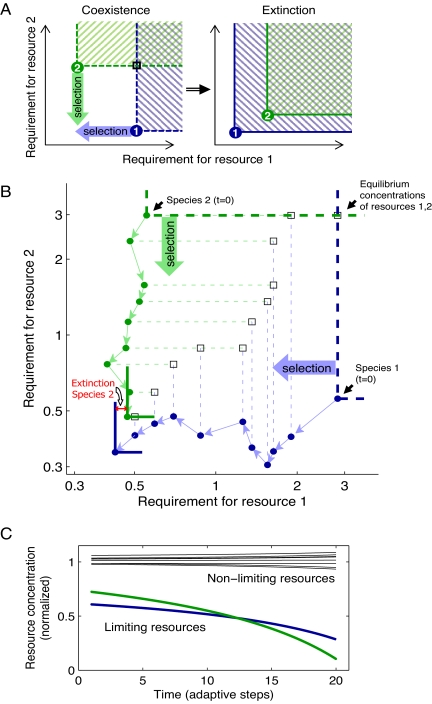
Can biodiversity evolve and persist in a uniform environment? This question is at the heart of the plankton paradox: in the natural world we observe many species sharing few resources, whereas the principle of competitive exclusion would lead us to expect that only a few species could coexist in such circumstances. To bridge the gap between theory and observation, previous studies have shown that the maximum number of species that can stably coexist is equal to the number of essential resources and that even more species can coexist out of equilibrium. These studies were viewed as a significant step toward a resolution of the paradox. Evolutionary dynamics, however, have been studied in this context only in limited cases, and it is largely unknown how mutations impact ecologically stable multispecies states, and whether large species consortia can spontaneously evolve. In the present study we introduce evolution to the standard ecological model of competition for essential resources. Combining numeric and analytic approaches, we find that ecologically stable species communities are severely destabilized by long-term evolutionary dynamics. Moreover, the number of species in spontaneously evolved consortia is much lower than the number of available resources. Contrary to expectations based on studies of two resources, these limits on biodiversity are not results of the occasional emergence of superspecies, superior to all competitors; nor are they alleviated by the inclusion of tradeoffs in resource utilization. Rather, we show that it is an accelerated depletion of limiting resources, combined with the essentiality of resources to all species, that leads invariably to catastrophic extinctions.


Conflict of interest statement

The authors declare no conflict of interest.

Figures

Fig. 1.
Fig. 1.
Schematic illustration of ecological and mutational perturbations of species consortia. Abundances of each species (height of the different color bands) are shown as a function of time, starting with an ecologically stable system. After an ecological perturbation—a small deviation from equilibrium values of the concentrations of resources or abundances of species—an ecologically stable system will return to its equilibrium (A). After an adaptive mutation in one of the species, the new mutant lineage might (B) replace only its ancestor, thus keeping the number of species constant (i.e., microadaptation); (C) invade a new niche and coexist with its ancestor and the other initial species, thus incrementing the number of species by one (i.e., speciation); or (D) drive more than one other species to extinction, thus decreasing the number of coexisting species (i.e., extinction).
Fig. 2.
Fig. 2.
The number of species maintained by evolution is small, even when the environment contains many resources. (A) Typical trajectories of the number of species in an environment with k = 50 resources, starting with six different initial numbers of species (1, 10, 20, 30, 40, and 50) in ecological equilibrium. Once mutations are introduced (t = 0), all these trajectories quickly reach an evolutionarily stable state with a small number of species (nevol). (B) The average number of species sustained by evolution is increasing very weakly with the number of resources in the environment (n = nevol, red curve) compared with the largest possible number of species that can coexist in equilibrium in the absence of mutations (n = k, black line). For a given k, the value of nevol is the average of 500 adaptive steps of 20 evolutionary runs, skipping the first 500 steps of each run. See SI Appendix.
Fig. 3.
Fig. 3.
Decline in community size is determined by properties of the evolved species rather than by constraints on the ecological dynamics. Shown is the number of species as a function of time in a typical evolutionary run with k = 20 resources. The actual number of species obtained in the simulation following each adaptive step (black squares) almost always equals the size of the largest possible subset of species at that step that includes the new beneficial mutant, and that can coexist in equilibrium (blue squares). Only two cases are seen in this example in which the actual number of species reached is smaller than the maximal possible (empty blue squares at t = 4 and t = 21). (Inset) Distributions of number of species within all of the species subsets that include the new mutant lineage and allow ecological equilibrium at two representative adaptive steps of extinction and speciation (down-pointing red arrows and up-pointing green arrows). The maximum of each distribution, corresponding to the largest possible stable species consortium, is indicated by the blue squares. The arrows indicate the actual change in the number of species at these two steps.
Fig. 4.
Fig. 4.
Depletion of limiting resources by evolutionary adaptation leads to extinctions and reduces the chance for speciation. Schematic diagram (A) and simulation results (B) show two evolving species (“1,” blue; “2,” green) characterized by their minimal requirement for each of two resources (green and blue points). (B) Species are competing for a total of 10 resources, but only the two limiting ones are shown. Resource concentrations on the L-shaped lines going through these points result in growth rates that exactly balance the mortality rate (i.e., zero isoclines). Net growth for each species is positive above its zero isocline (hashed in A). Intersection of the zero isoclines is required for species coexistence and defines the equilibrium concentration of resources (black squares). At such equilibrium, each species is limited by a different resource (species 1 by resource 1 and 2 by 2). Selection acts to reduce requirement for the most limiting resource of each species (blue and green heavy arrows) and pushes the corresponding limiting resource down (individual adaptive steps are shown in B by thin blue and green arrows). Ultimately, this results in extinction of one of the species (species 2), as the resource limiting the other species falls below its requirement (A and B, solid blue isocline contains solid green isocline). (C) Smoothed curves of data from the simulation in B show the concentration of the two limiting resources decreasing compared with the eight other nonlimiting resources (black). Values are normalized by the median concentration of all resources.

References

    1. Hutchinson GE. The paradox of the plankton. Am Nat. 1961;95:137–145.
    1. Petersen R. The paradox of plankton: an equilibrium hypothesis. Am Nat. 1975;109:35–49.
    1. Monod J. La technique de culture continue theorie et applications. Ann Inst Pasteur. 1950;79:390–410.
    1. Herbert DR, Elsworth R, Telling RC. The continuous culture of bacteria: a theoretical and experimental study. J Gen Microbiol. 1956;14:601–622. - PubMed
    1. Dugdale RC. Nutrient limitation in the sea: Dynamics identification and significance. Limnol Oceanogr. 1967;12:685–695.

LinkOut - more resources