. 2008 Sep 1;181(5):3116-25.
doi: 10.4049/jimmunol.181.5.3116.

MUC1 enhances tumor progression and contributes toward immunosuppression in a mouse model of spontaneous pancreatic adenocarcinoma

Affiliations

MUC1 enhances tumor progression and contributes toward immunosuppression in a mouse model of spontaneous pancreatic adenocarcinoma

Teresa L Tinder et al. J Immunol. .

Abstract

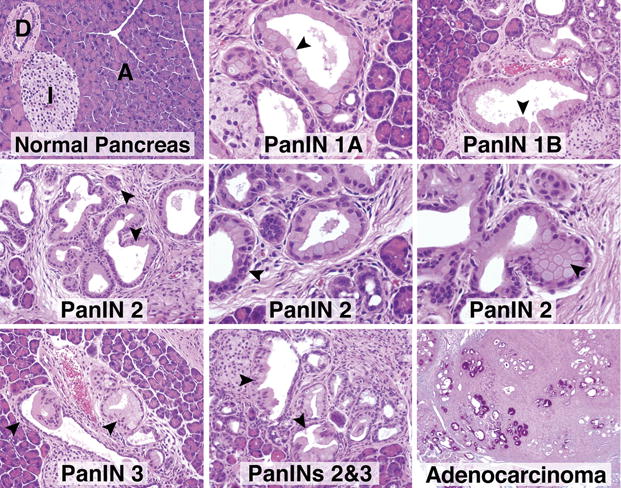
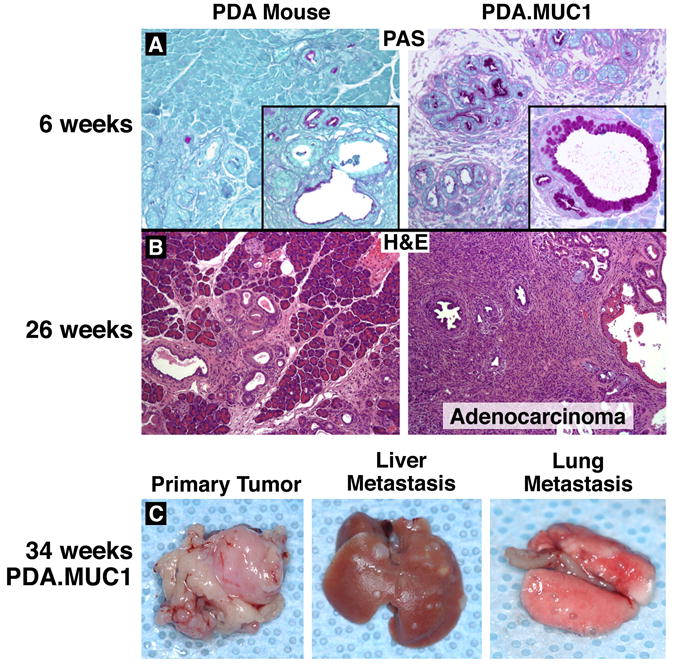
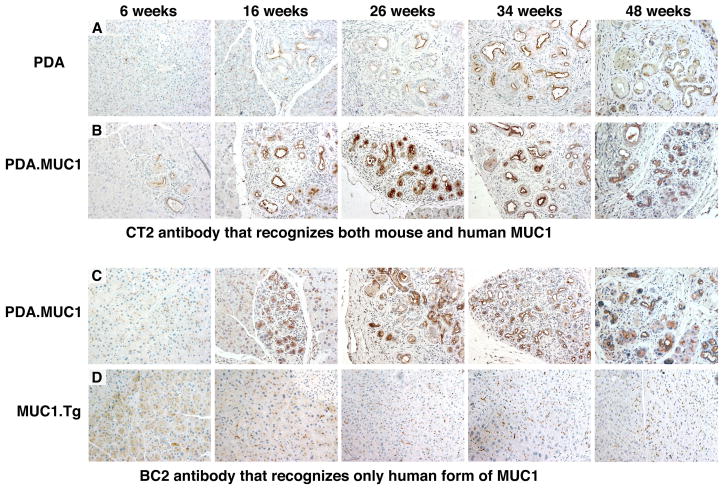
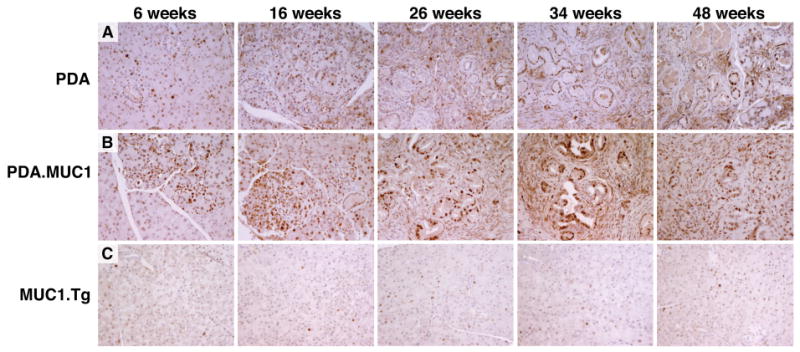
MUC1, a membrane tethered mucin glycoprotein, is overexpressed and aberrantly glycosylated in >80% of human ductal pancreatic adenocarcinoma. However, the role of MUC1 in pancreatic cancer has been elusive, partly due to the lack of an appropriate model. We report the characterization of a novel mouse model that expresses human MUC1 as a self molecule (PDA.MUC1 mice). Pancreatic tumors arise in an appropriate MUC1-tolerant background within an immune-competent host. Significant enhancement in the development of pancreatic intraepithelial preneoplastic lesions and progression to adenocarcinoma is observed in PDA.MUC1 mice, possibly due to increased proliferation. Tumors from PDA.MUC1 mice express higher levels of cyclooxygenase-2 and IDO compared with PDA mice lacking MUC1, especially during early stages of tumor development. The increased proinflammatory milieu correlates with an increased percentage of regulatory T cells and myeloid suppressor cells in the pancreatic tumor and tumor draining lymph nodes. Data shows that during pancreatic cancer progression, MUC1-mediated mechanisms enhance the onset and progression of the disease, which in turn regulate the immune responses. Thus, the mouse model is ideally suited for testing novel chemopreventive and therapeutic strategies against pancreatic cancer.


Figures

Figure 1
Figure 1. Schematic representation of PDA and PDA.MUC1 mice
PDA mice were mated to the human MUC1.Tg mice that were maintained as heterozygotes.
Figure 2
Figure 2. Histology of normal pancreas and histopathology of PanIN lesions and adenocarcinoma in pancreas from PDA.MUC1 mice
Hematoxylin and eosin (H&E) staining of pancreas tissues from PDA.MUC1 mice. Images are captured at 200× magnification. Representative images are shown depicting the various stages of PanIN lesions and adenocarcinoma. D: duct; I: Islet; A: acinar. Arrows indicate PanINs lesions. Normal pancreas is from a 24-week old MUC1.Tg mouse.
Figure 3
Figure 3. Enhanced progression of tumors in PDA.MUC1 mice
A-E) Panels showing average number of PanINs in 5 consecutive sections and 10 fields per section from each mouse. Average of 10 mice per time point is shown. F) Numbers of mice (out of 10 per timepoint) with invasive adenocarcinoma. G) Wet weight of pancreas at each timepoint. *p<0.01; **p<0.0001 as compared to PDA mice.
Figure 4
Figure 4. Enhanced PanIN and adenocarcinoma development with liver and lung metastasis in PDA.MUC1
A) Mucus accumulation in PanIN lesions as determined by periodic acid Schiff reaction (purple staining) in pancreas tissues from 6-week-old mice. B) At 26 weeks, PDA.MUC1 mice develop adenocarcinoma (H&E) at which time no adenocarcinoma is observed in the PDA mice. C) Representative 200× images of a primary pancreas tumor, liver, and lung metastases in PDA.MUC1 mice. N=15 mice per time point have been evaluated with similar results.
Figure 5
Figure 5. Muc/MUC1 expression increases with tumor progression
Staining was done using A) CT2, a monoclonal antibody that recognizes the cytoplasmic tail of both mouse Muc1 and human MUC1, and B) BC2, a monoclonal antibody directed against the tandem repeat of only human MUC1. Representative images were captured at 200× magnification. N=15 mice per time point have been evaluated with similar results. For comparison, pancreas sections from age-matched MUC1.Tg mice are shown.
Figure 6
Figure 6. Greater PCNA positivity in the PDA.MUC1 pancreas
Representative sections were stained with PCNA to assess level of proliferative tumor cells in A) PDA mice, B) PDA.MUC1 mice, and C) MUC1.Tg mice. Dark brown nuclear staining represents proliferating cells. N=15 mice have been assessed giving similar results. Images were captured at 200× magnification.
Figure 7
Figure 7. Circulating MUC1 levels and MUC1-specific immune responses
Circulating MUC1 levels were determined in serum of PDA.MUC1 mice by ELISA Average of n=10 mice are shown. *p<0.001 and **p<0.0001 compared to levels in 6 and 16 week old mice. B) Cells from TDLNs were assessed for IFN-γ production in response to human MUC1 or mouse Muc1 peptides by ELISPOT Average of n=10 mice are shown. *p<0.05 at 6 weeks; **p<0.001 at 16 weeks compared to PDA mice. C) Determination of CTL activity was performed using a standard 51Cr-release method. T cells from TDLNs served as effector cells, autologous irradiated DCs pulsed with MUC1 TR peptide were used as stimulator cells and targets were B16.MUC1 cells (o) or B16.neo cells (x). Data from individual mice are shown. *p<0.001 and **p<0.0001 as compared to previous timepoint.
Figure 8
Figure 8. COX-2 and IDO activity is enhanced in PDA.MUC1 mice
A) COX-2 staining and B) IDO staining of pancreas from various ages of PDA.MUC1 mice. For comparison, MUC1.Tg pancreas from a 36-week old mouse is shown. Images were captured at 200× magnification. Brown staining represents COX-2 or IDO positivity. N=15 mice per time point have been evaluated with similar results. Serum levels of C) PGEM; D) kynurenine; and E) tryptophan in PDA, PDA.MUC1 and MUC1.Tg mice at various ages. An average of ten mice is shown with p-values calculated in comparison with MUC1.Tg mice (control). *p<0.01;**p<0.0001 compared to MUC1.Tg control values.
Figure 9
Figure 9. Increased percent of Tregs and MSCs in pancreas and TDLNs of PDA.MUC1 mice
Flow cytometric analysis evaluating percentages of CD4+/FOXP3+/CD25+ Tregs in A) tumor and B) TDLNs of the PDA.MUC1 and PDA mice as a function of age. N=10 mice per time were evaluated. Significant increase (*p<0.05; **p<0.01; and ***p<0.001) in Tregs are noted. Representative images are shown of i) forward and side scatter; box represents the gate around the lymphocyte population; ii) CD4+ T cells on the gated lymphocyte population, and iii) FL1 and FL2 scatter plot; box represents the CD25+ and FoxP3+ double positive cells gated on the CD4+ T cell population. C) Flow cytometric analysis evaluating percentages of CD11b+/Gr1+ MSCs in tumors of the PDA.MUC1 and PDA mice as a function of age. N=10 mice per time are evaluated. **p<0.0001 at 26 weeks; *p<0.01 at 34 and 48 weeks. Representative images are shown for i) forward and side scatter of the entire pancreas; box represents the gate around the granulocyte population; ii) CD11b+/Gr1+ double positive cells gated on the granulocyte population.

References

    1. Jemal A, Siegel R, Ward E, Murray T, Xu J, Smigal C, Thun MJ. Cancer statistics, 2006. CA Cancer J Clin. 2006;56:106–130. - PubMed
    1. Sener SF, Fremgen A, Menck HR, Winchester DP. Pancreatic cancer: a report of treatment and survival trends for 100,313 patients diagnosed from 1985-1995, using the National Cancer Database. J Am Coll Surg. 1999;189:1–7. - PubMed
    1. Neoptolemos JP, Stocken DD, Friess H, Bassi C, Dunn JA, Hickey H, Beger H, Fernandez-Cruz L, Dervenis C, Lacaine F, Falconi M, Pederzoli P, Pap A, Spooner D, Kerr DJ, Buchler MW. A randomized trial of chemoradiotherapy and chemotherapy after resection of pancreatic cancer. N Engl J Med. 2004;350:1200–1210. - PubMed
    1. Hingorani SR, Petricoin EF, III, Maitra A, Rajapaske V, King C, Jacobetz MA, Ross S, Conrads TP, Veenstra TD, Hitt BA, Kawaguchi Y, Johann D, Liotta LA, Crawford HC, Putt MA, Jacks T, Wright CV, Hruban R, Lowy AM, Tuveson DA. Preinvasive and invasive ductal pancreatic cancer and its early detection in the mouse. Cancer Cell. 2003;4:437–450. - PubMed
    1. Kawaguchi Y, Cooper B, Gannon M, Ray M, MacDonald RJ, Wright CV. The role of the transcriptional regulator Ptf1a in converting intestinal to pancreatic progenitors. Nat Genet. 2002;32:128–134. - PubMed

Publication types