

Prognostic breast cancer signature identified from 3D culture model accurately predicts clinical outcome across independent datasets
- PMID: 18714348
- PMCID: PMC2500166
- DOI: 10.1371/journal.pone.0002994
Prognostic breast cancer signature identified from 3D culture model accurately predicts clinical outcome across independent datasets
Abstract
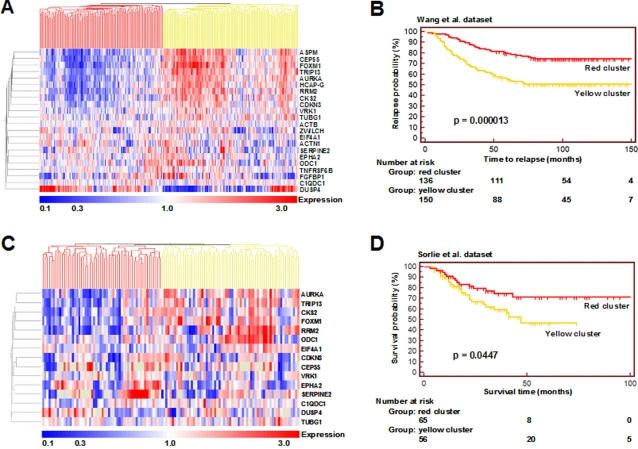
Background: One of the major tenets in breast cancer research is that early detection is vital for patient survival by increasing treatment options. To that end, we have previously used a novel unsupervised approach to identify a set of genes whose expression predicts prognosis of breast cancer patients. The predictive genes were selected in a well-defined three dimensional (3D) cell culture model of non-malignant human mammary epithelial cell morphogenesis as down-regulated during breast epithelial cell acinar formation and cell cycle arrest. Here we examine the ability of this gene signature (3D-signature) to predict prognosis in three independent breast cancer microarray datasets having 295, 286, and 118 samples, respectively.
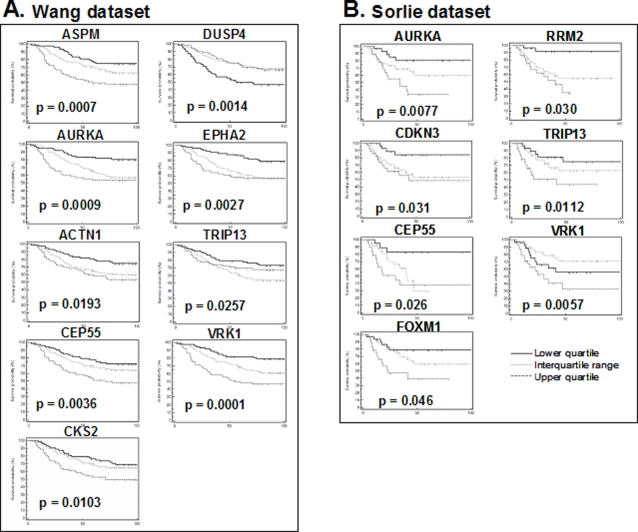
Methods and findings: Our results show that the 3D-signature accurately predicts prognosis in three unrelated patient datasets. At 10 years, the probability of positive outcome was 52, 51, and 47 percent in the group with a poor-prognosis signature and 91, 75, and 71 percent in the group with a good-prognosis signature for the three datasets, respectively (Kaplan-Meier survival analysis, p<0.05). Hazard ratios for poor outcome were 5.5 (95% CI 3.0 to 12.2, p<0.0001), 2.4 (95% CI 1.6 to 3.6, p<0.0001) and 1.9 (95% CI 1.1 to 3.2, p = 0.016) and remained significant for the two larger datasets when corrected for estrogen receptor (ER) status. Hence the 3D-signature accurately predicts breast cancer outcome in both ER-positive and ER-negative tumors, though individual genes differed in their prognostic ability in the two subtypes. Genes that were prognostic in ER+ patients are AURKA, CEP55, RRM2, EPHA2, FGFBP1, and VRK1, while genes prognostic in ER- patients include ACTB, FOXM1 and SERPINE2 (Kaplan-Meier p<0.05). Multivariable Cox regression analysis in the largest dataset showed that the 3D-signature was a strong independent factor in predicting breast cancer outcome.
Conclusions: The 3D-signature accurately predicts breast cancer outcome across multiple datasets and holds prognostic value for both ER-positive and ER-negative breast cancer. The signature was selected using a novel biological approach and hence holds promise to represent the key biological processes of breast cancer.
Conflict of interest statement
Figures
References
-
- Cancer Facts & Figures. Atlanta: American Cancer Society; 2007.
-
- Edgren H, Kallioniemi O. Integrated breast cancer genomics. Cancer Cell. 2006;10:453–454. - PubMed
-
- Acharya CR, Hsu DS, Anders CK, Anguiano A, Salter KH, et al. Gene expression signatures, clinicopathological features, and individualized therapy in breast cancer. Jama. 2008;299:1574–1587. - PubMed
-
- Hinestrosa MC, Dickersin K, Klein P, Mayer M, Noss K, et al. Shaping the future of biomarker research in breast cancer to ensure clinical relevance. Nat Rev Cancer. 2007;7:309–315. - PubMed
Publication types
MeSH terms
Substances
Grants and funding
LinkOut - more resources
Full Text Sources
Other Literature Sources
Medical
Miscellaneous
