. 2008 Aug 19;5(8):e171.
doi: 10.1371/journal.pmed.0050171.

Two faces of chondroitin sulfate proteoglycan in spinal cord repair: a role in microglia/macrophage activation

Affiliations

Two faces of chondroitin sulfate proteoglycan in spinal cord repair: a role in microglia/macrophage activation

Asya Rolls et al. PLoS Med. .

Abstract

Background: Chondroitin sulfate proteoglycan (CSPG) is a major component of the glial scar. It is considered to be a major obstacle for central nervous system (CNS) recovery after injury, especially in light of its well-known activity in limiting axonal growth. Therefore, its degradation has become a key therapeutic goal in the field of CNS regeneration. Yet, the abundant de novo synthesis of CSPG in response to CNS injury is puzzling. This apparent dichotomy led us to hypothesize that CSPG plays a beneficial role in the repair process, which might have been previously overlooked because of nonoptimal regulation of its levels. This hypothesis is tested in the present study.

Methods and findings: We inflicted spinal cord injury in adult mice and examined the effects of CSPG on the recovery process. We used xyloside to inhibit CSPG formation at different time points after the injury and analyzed the phenotype acquired by the microglia/macrophages in the lesion site. To distinguish between the resident microglia and infiltrating monocytes, we used chimeric mice whose bone marrow-derived myeloid cells expressed GFP. We found that CSPG plays a key role during the acute recovery stage after spinal cord injury in mice. Inhibition of CSPG synthesis immediately after injury impaired functional motor recovery and increased tissue loss. Using the chimeric mice we found that the immediate inhibition of CSPG production caused a dramatic effect on the spatial organization of the infiltrating myeloid cells around the lesion site, decreased insulin-like growth factor 1 (IGF-1) production by microglia/macrophages, and increased tumor necrosis factor alpha (TNF-alpha) levels. In contrast, delayed inhibition, allowing CSPG synthesis during the first 2 d following injury, with subsequent inhibition, improved recovery. Using in vitro studies, we showed that CSPG directly activated microglia/macrophages via the CD44 receptor and modulated neurotrophic factor secretion by these cells.

Conclusions: Our results show that CSPG plays a pivotal role in the repair of injured spinal cord and in the recovery of motor function during the acute phase after the injury; CSPG spatially and temporally controls activity of infiltrating blood-borne monocytes and resident microglia. The distinction made in this study between the beneficial role of CSPG during the acute stage and its deleterious effect at later stages emphasizes the need to retain the endogenous potential of this molecule in repair by controlling its levels at different stages of post-injury repair.


Conflict of interest statement

Competing Interests: The authors declare that they have no competing interests.

Figures

Figure 1
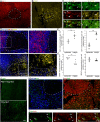
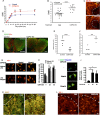
Figure 1. Microglia and Blood-borne Monocytes Associated with CSPG Found in the Lesion Site Express High Levels of IGF-1
Paraffin-embedded spinal cord sections were prepared from the lesion site 14 d after injury. (A and B) Sections were immunolabeled for IGF-1 (A) or BDNF (B) (scale bar 500 μm). (C) Sections were labeled with IB-4 (green), to identify microglia/macrophages and IGF-1 (red; left panels) or BDNF (yellow; right panels) (scale bars, 10 μm; arrows indicate double-labeled cells). (D) Labeling by CS-56 (blue), a marker of CSPG and IGF-1 (red, upper panels) colocalized at the margins of the lesion site. BDNF expression (yellow, lower panels) is not specifically colocalized with CS-56 immunoreactivity (blue, all panels; scale bar, 100 μm). High-power images of the boxed area in the left panels are shown on the right (scale bar, 20 μm). (E and F) Quantitative analysis of IGF-1 (E) and BDNF (F) immunoreactivity, at the epicenter and the margins of the lesion calibrated to either intensity per square millimeter. Total intensity in the examined region was normalized to the size of the area (left graphs, arbitrary units, Student t-test, [E] t = −5.03, df = 8; p = 0.001; [F] t = 4.55, df = 8, p = 0.002) or intensity per cell (total intensity in the examined region normalized to the number of IB-4 labeled cells; right graphs, arbitrary units, Student t-test: [E] t = −7.4, df = 8, p = 0.0001; [F] t = 0.97, df = 8, p = 0.36). *p < 0.05; **p < 0.01; ***p < 0.001. (G) Sections from GFP-chimeric mice labeled for GFP (blood-derived macrophages; green) in non-injured and injured mice (scale bar, 100 μm). (H and I) Lesion site in chimeric injured mice, labeled for CS-56 (blue) (H) and GFP (green) or IB-4 (red) (I) and GFP (green; scale bars 10 μm). (J) High magnification of cells from the marginal area of the lesion, indicating that both GFP-positive (green) and GFP-negative cells express IGF-1 (red; scale bar, 20 μm). Arrows indicate blood-derived macrophages (GFP-positive) cells expressing IGF-1. In all panels, boundaries between the epicenter and the margins are marked by dashed line.
Figure 2
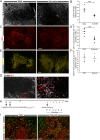
Figure 2. CSPG Modulates Microglia/Macrophage Activation and Spatial Localization in the Lesion Site
After spinal cord injury, mice were injected IP with xyloside (1.2 mg/mouse/d, for 6 d), a pharmacological inhibitor of CSPG synthesis. (A) CS-56 staining of spinal cord sections for the presence of CSPG (scale bar, 250 μm). (B) Quantitative analysis of CSPG intensity in the diameter of 1 mm around the epicenter (arbitrary units; Student t-test, t = 5.61, df = 9, p = 0.0003). (C) Staining for IGF-1 (red; scale bar, 250 μm). (D) Quantitative analysis of IGF-1 immunoreactivity per square millimeter, at the site (arbitrary units; Student t-test, t = 4.5, df = 8, p = 0.002). (E) Staining for BDNF (yellow; scale bar, 250 μm). (F) Quantitative analysis of BDNF immunoreactivity at the site (arbitrary units; nonsignificant according to Student t-test, t = 0.21, df = 11, p = 0.83). (G) Representative photomicrographs of CS-56-labeled spinal cord sections from mice treated with xyloside (scale bar, 250 μm). The boxed area in the left panel is magnified on the right and shows labeling for IGF-1 (red) and CS-56 (CSPG; white; scale bar, 20 μm). (H) Scheme showing experimental time scale. Bone marrow chimeras were generated by reconstitution of irradiated C57BL/6J mice with CX3CR1GFP/+ bone marrow. After 2 mo, chimeric mice were subjected to spinal cord injury and injected IP with xyloside. (I) Staining for GFP (green; blood-borne macrophages) and IB-4 (red; microglia/macrophages) at the injury site in control (left) and in xyloside-treated (right) animals (scale bar, 100 μm; ** p < 0.01; *** p < 0.001).
Figure 3
Figure 3. CSPG Plays a Key Role in Recovery from Spinal Cord Injury
(A) Staining for myelin by Luxol (blue) and to nuclei by Nissel (pink) (scale bar, 500 μm). (B) Quantitative analysis of the size of the site of injury as a function of the xyloside dosages, determined by Luxol and Nissel staining (ANOVA, F[3,17] = 37.5, p = 0.0001, followed by Fisher test for differences between groups). Results were significant at the 5% level in all cases except for xyloside treatment (0.3 mg/d) compared to PBS, and for xyloside treatment at 0.3 mg/d compared to 0.6 mg/d. (C) Immunohistochemistry of xyloside-treated spinal cords, using anti-GFAP (green) antibodies and IB-4 labeling (red) (scale bar, 250 μm). (D) Mean locomotor score (BMS) of individual mice on day 36 after spinal cord injury with and without xyloside treatment (immediately after injury 0.8 mg/mouse/d; Student t-test, t = 2.67, df = 14, p = 0.018). * p < 0.05.
Figure 4
Figure 4. Restricting CSPG Secretion to the Acute Stage after Injury Improves Functional Recovery
(A) Schematic representation of the experimental time scale. Mice were subjected to contusive spinal cord injury and were treated with xyloside (0.8 mg/mouse/d for 6 d) at different time points after the injury. Locomotion was recorded, and is given by the mean locomotor scores (BMS) for each group. (B) Xyloside application started 2 d after the injury (repeated measures ANOVA, F[1,15] = 7.426 [between groups], p = 0.016). (C) Xyloside application started immediately after the injury (two factor repeated measures ANOVA, F[1,14] = 15.481 [between groups], p = 0.0015). (D) Xyloside application started 7 d after the injury (repeated measures ANOVA, F[1,15] = 0.093 [between groups], p = 0.764). (E) Fold change in functional recovery on day 30 after the injury between each treatment compared to their matched untreated control (ANOVA, F[2,27] = 16.64, p = 0.0001). (F) BDA tracing of the corticospinal tract, caudal to the lesion site in a xyloside-treated mouse; photomicrographs show cornal sections excised from mice treated with xyloside on day 0 (left) or 2 (right) after the injury (scale bars, 250 μm). Insert shows the site from which the images were taken. (G) Quantitative analysis of BDA labeling. To quantify labeled fibers caudal to the lesion, we calculated the labeling caudal to the lesion site relative to the amount of BDA rostal to the lesion for each animal (mean ± SD; Student t-test, t = −3.99, df = 6, p = 0.007). (H) Immunohistochemistry of xyloside-treated spinal cords, using anti-GFAP (green) antibodies and IB-4 labeling (red; scale bars, 250 μm). (I) Quantitative analysis of the size of the injury site as a function of the treatment, determined by Luxol and Nissel staining (ANOVA, F[3,26] = 43.03, p = 0.0001). (J) CS-56 staining of spinal cord sections, excised from mice 14 d after the injury, for the presence of CSPG (scale bar, 250 μm). The dashed line demarcates the lesion site, defined based on GFAP labeling. (K) Quantification of CSPG intensity (ANOVA, F[3,12] = 7.619, p = 0.0041). (L) Western blot analysis of CSPG levels in the control group (PBS) and in the groups receiving xyloside treatment on day 0 or day 2 after the injury (excised 7 d after the injury). β-actin was used as a control for protein levels. Fold decrease in CSPG levels, relative to PBS control, are shown (n = 3 mice per group). ANOVA in (I) and (K) followed by the Fisher test for differences among groups (significant at the 5% level). Asterisks (G, I, and K) denote statistically significant differences between the indicated groups, or compared to the relevant control: *p < 0.05; **p < 0.01.
Figure 5
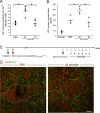
Figure 5. Delayed Inhibition of CSPG Synthesis Positively Modulates Activation and Spatial Localization of Microglia/Macrophages in the Lesion Site
Spinal cords were excised (14 d after the lesion) from animals that were subjected to spinal cord injury and treated with either PBS or with xyloside administered on day 2 or day 7 following the insult. (A) Quantitative analysis of IGF-1 immunoreactivity per square millimeter at the site (ANOVA, F[2,11] = 22.78, p = 0.0001). (B) Quantitative analysis of IGF-1 protein concentration determined by ELISA of spinal cord tissue (ANOVA, F[3,12] = 32.138, p = 0.0001). (C) Experimental time scale. CX3CR1GFP/+ > wild type bone marrow chimeras were generated by reconstitution of irradiated C57BL/6J mice with CX3CR1GFP/+ bone marrow. Chimeric mice were subjected to spinal cord injury and injected IP with xyloside starting from day 2 after the injury. (D) Staining for GFP (green; blood-borne macrophages) and IB-4 (red; microglia/macrophages) at the injury site in control (PBS) and in delayed (day 2) xyloside-treatment group (scale bar, 250 μm). ANOVA followed by the Fisher test for differences between groups; significant differences at the 5% level are denoted by asterisks. All the groups in (B) were significantly different from uninjured control.
Figure 6
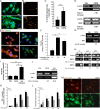
Figure 6. CSPG Activates Microglia to Acquire a Noncytotoxic, Beneficial Phenotype
(A) IB-4 labeling (green) and Hoechst (nuclear; blue) of microglia cultured on PDL or on CSPG for 48 h showing morphological changes in the CSPG-cultured microglia (scale bar, 10 μm). (B) BrdU incorporation showing increased proliferation induced by microglia cultured on CSPG relative to PDL-cultured microglia (scale bar, 100 μm). (C) Quantitative analysis of the proportion of BrdU-incorporating cells in the total population of IB-4+ cells (Student t-test, t = 4.24, df = 6, p = 0.005). (D) Semi-quantitative PCR analyses of IGF-1 and BDNF expression by microglia cultured for 12 h on PDL or on CSPG. Values represent relative amounts of amplified mRNA normalized against β-actin in the same sample, and are represented as fold induction relative to control microglia cultured on PDL. (E) IGF-1 (red) and BDNF (green) expression in microglia cultured for 18 h on PDL or on CSPG (scale bar, 20 μm). Hoechst labeling is blue. (F) Quantitative analysis of IGF-1 immunoreactivity in microglia cultured for 12, 18, and 48 h on CSPG (ANOVA, F[2,6] = 185.2, p = 0.0001, followed by the Fisher test). (G) Semi-quantitative PCR analyses of IRS-1 expression by microglia cultured on PDL and on CSPG. (H) Semi-quantitative PCR analyses of MMP-2 and MMP-9 mRNA in microglia cultured on PDL and on CSPG for various time periods. Values represent relative amounts of amplified mRNA normalized against β-actin in the same sample, and are represented as fold change in microglia cultured on CSPG relative to PDL at the same time point (C, CSPG; P, PDL). (I) Nitric oxide levels in the culture media of microglia cultured for 48 h on PDL or CSPG or in the presence of LPS (50 ng/ml) (ANOVA, F[2,9] = 114.9, p = 0.0001, followed by the Fisher test). (J) Semi-quantitative PCR analysis of TNF-α expression indicating that TNF-α was not increased in CSPG-activated microglia, but was significantly increased upon activation of microglia by LPS (12 h). Values represent relative amounts of amplified mRNA normalized against β-actin in the same sample, and are represented as fold induction relative to control microglia cultured on PDL. (K–M) Cells were cultured on PDL and CSPG, 24 h prior to their stimulation with LPS for an additional 24 h. Quantitative analysis of TNF-α production (K) or cell-body size (L) in microglia activated by increasing doses of LPS (M), representative photos; TNF-α (red) and IB-4 (green) labeling of microglia (scale bar, 20 μm). Two-way ANOVA was used for statistical analysis in (K) (F[7,17] = 34.3, p = 0.0001) and (L) (F[7,53] = 19.47, p = 0.0001), followed by the Fisher test (*p = 0.05). The changes were significant between the CSPG- and PDL-cultured microglia. All data are from one of at least three independent experiments with replicate cultures. *p < 0.05; **p < 0.01.
Figure 7
Figure 7. Microglial Activation by CSPG Is Mediated by CD44
(A) Anti-phospho-ERK1/2 labeling (green) indicating increased phosphorylation of ERK1/2 in microglia (IB-4; red) cultured on CSPG. In this culture, addition of CD44-neutralizing antibodies to the medium resulted in decreased ERK1/2 phosphorylation (scale bar, 20 μm). Arrows indicate microglia labeled with pERK1/2. (B) Quantitative analysis of pERK1/2-positive, IB-4-positive cells. Data are from one of at least three independent experiments in replicate cultures (P, PDL; C, CSPG; ANOVA, F[3,17] = 158.7, p = 0.0001; followed by Fisher test, *p = 0.05).
Figure 8
Figure 8. Systemic Administration of CSPG-DS Promotes Recovery after Spinal Cord Injury
(A) Mean locomotor score (BMS) for each group during the 60-d recovery period (repeated measures ANOVA, F[1,31] = 15.47 [between groups], p = 0.0004). After injuries of similar severity, recovery was significantly improved as a result of CSPG-DS treatment. (B–D) BMS scores of individual mice on day 60 after spinal cord injury (Student t-test, t = −5.52, df = 31, p = 0.0001) (B). Spinal cord sections from injured mice treated with CSPG-DS (5 μg) or PBS were immunolabeled with CS-56 (CSPG, red; scale bar 100 μm) (C), GFAP (astrocytes, green), and IB-4 (microglia/macrophages, red; scale bar, 100 μm) of the lesion site in coronal sections (D). (E) Quantitative analysis of the IB-4-labeled area, indicative of the lesion site (Student t-test, t = −5.53, df = 10, p = 0.0003). (F) Quantitative analysis of BDA labeling. Sections that contained more than two labeled fibers caudal to the lesion site were counted and presented in percentage (Student t-test, t = −4.81, df = 6, p = 0.003). (G) IGF-1 immunoreactivity (red) in microglia treated with CSPG-DS in the presence or absence of LPS (scale bar, 20 μm). (H) Quantitative analysis of IGF-1 immunoreactivity in the CSPG-DS-treated microglia, with (gray) and without LPS (black) (ANOVA, F[5,19] = 10.63, p = 0.0001; followed by the Fisher test; the changes were significant at 95% between the CSPG-DS-treated microglia and the PBS-treated controls). (I) BDNF immnoreactivity (green) and Hoechst labeling (blue) in microglia treated with CSPG-DS (scale bar, 10 μm). (J) Quantitative analysis of BDNF immunoreactivity in the CSPG-DS-treated microglia (ANOVA, F[2,9] = 23.16, p = 0.0003; followed by the Fisher test). (K) BDNF labeling (yellow) of microglia in the lesion site (scale bar, 20 μm). The image depicts the marginal area of the lesion. (L) IGF-1 staining (red) of microglia in the lesion (scale 20 μm). The image depicts the epicenter of the lesion. The dashed line demarcates the lesion site. All data in (G)–(J) are from one of at least three independent experiments with replicate cultures. *p < 0.05; **p < 0.01; ***p < 0.001.

References

    1. Silver J, Miller JH. Regeneration beyond the glial scar. Nat Rev Neurosci. 2004;5:146–156. - PubMed
    1. Buss A, Pech K, Kakulas BA, Martin D, Schoenen J, et al. Growth-modulating molecules are associated with invading Schwann cells and not astrocytes in human traumatic spinal cord injury. Brain. 2007;130:940–953. - PubMed
    1. Fitch MT, Silver J. Activated macrophages and the blood-brain barrier: inflammation after CNS injury leads to increases in putative inhibitory molecules. Exp Neurol. 1997;148:587–603. - PubMed
    1. Fournier AE, Strittmatter SM. Repulsive factors and axon regeneration in the CNS. Curr Opin Neurobiol. 2001;11:89–94. - PubMed
    1. Popovich PG, Guan Z, Wei P, Huitinga I, van Rooijen N, et al. Depletion of hematogenous macrophages promotes partial hindlimb recovery and neuroanatomical repair after experimental spinal cord injury. Exp Neurol. 1999;158:351–365. - PubMed

Publication types

MeSH terms

Substances