. 2008 Nov;82(21):10418-28.
doi: 10.1128/JVI.01190-08. Epub 2008 Aug 20.

Enhancement of human immunodeficiency virus (HIV)-specific CD8+ T cells in cerebrospinal fluid compared to those in blood among antiretroviral therapy-naive HIV-positive subjects

Affiliations

Enhancement of human immunodeficiency virus (HIV)-specific CD8+ T cells in cerebrospinal fluid compared to those in blood among antiretroviral therapy-naive HIV-positive subjects

Shanmugalakshmi Sadagopal et al. J Virol. 2008 Nov.

Abstract

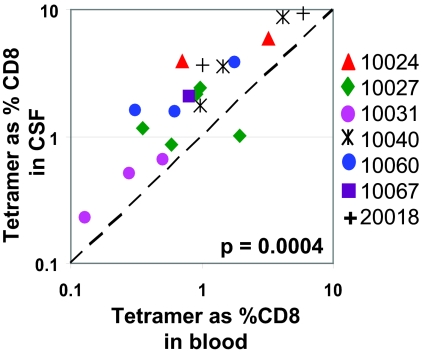
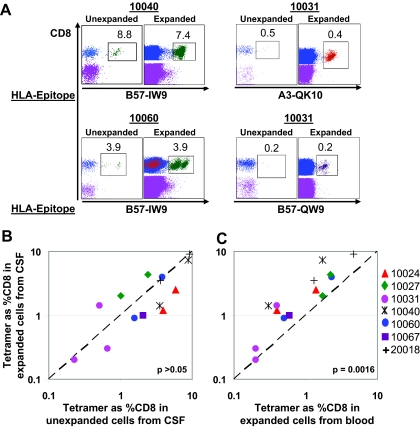
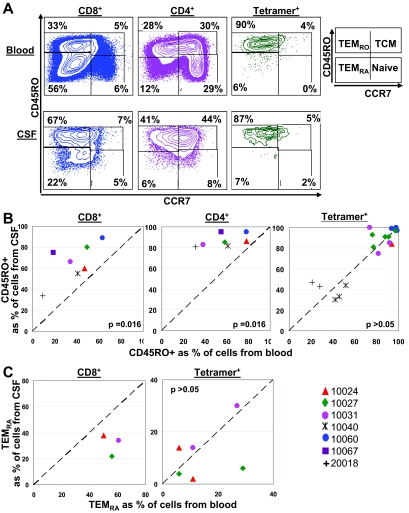
During untreated human immunodeficiency virus type 1 (HIV-1) infection, virus-specific CD8(+) T cells partially control HIV replication in peripheral lymphoid tissues, but host mechanisms of HIV control in the central nervous system (CNS) are incompletely understood. We characterized HIV-specific CD8(+) T cells in cerebrospinal fluid (CSF) and peripheral blood among seven HIV-positive antiretroviral therapy-naïve subjects. All had grossly normal brain magnetic resonance imaging and spectroscopy and normal neuropsychometric testing. Frequencies of epitope-specific CD8(+) T cells by direct tetramer staining were on average 2.4-fold higher in CSF than in blood (P = 0.0004), while HIV RNA concentrations were lower. Cells from CSF were readily expanded ex vivo and responded to a broader range of HIV-specific human leukocyte antigen class I restricted optimal peptides than did expanded cells from blood. HIV-specific CD8(+) T cells, in contrast to total CD8(+) T cells, in CSF and blood were at comparable maturation states, as assessed by CD45RO and CCR7 staining. The strong relationship between higher T-cell frequencies and lower levels of viral antigen in CSF could be the result of increased migration to and/or preferential expansion of HIV-specific T cells within the CNS. This suggests an important role for HIV-specific CD8(+) T cells in control of intrathecal viral replication.


Figures

FIG. 1.
FIG. 1.
Frequency of HIV-specific tetramer-positive cells among freshly isolated cells from CSF and blood. (A) Flow cytometric plots of all HLA-B57 tetramer-positive (IW9, KF11, and QW9) stains among seven asymptomatic HIV-infected individuals. (B) Flow cytometric plots from two HIV-infected individuals (10027 and 10031) with non-HLA-B*57 (HLA-B*08 and HLA*A*03, respectively) tetramer responses are shown. Each tetramer stain was performed with 1.0 × 10⁶ freshly isolated cells from blood and 0.5 × 10⁴ to 3.0 × 10⁴ freshly isolated cells from CSF. Numbers in plots represent frequencies of HIV-specific T cells as percentages of CD8+ T cells from CSF and blood.
FIG. 2.
FIG. 2.
Relationship between frequencies of tetramer-positive CD8+ T cells among freshly isolated cells from CSF and blood. Frequencies of HIV-specific tetramer-positive CD8+ T cells among seven asymptomatic HIV-infected individuals are derived from plots shown in Fig. 1. Each data point represents an individual tetramer response for each participant studied. The diagonal dashed line represents the line of unity. The P value is derived from a two-tailed Wilcoxon matched-pairs t test.
FIG. 3.
FIG. 3.
Frequencies of HIV-specific tetramer-positive cells among ex vivo expanded cells. CSFMCs and PBMCs were expanded ex vivo for 2 weeks with PHA and then assessed for frequencies of HIV-specific tetramer-positive CD8+ cells. (A) Representative flow cytometric plots show tetramer frequencies among unexpanded and expanded cells from CSF. (B) Relationship between tetramer frequencies among ex vivo expanded CD8+ cells from CSF and freshly isolated cells from CSF. (C) Relationship between tetramer frequencies among ex vivo expanded CD8+ cells from CSF and ex vivo expanded CD8+ cells from blood. The diagonal dashed line represents the line of unity. The P value is derived from a two-tailed Wilcoxon matched-pairs t test.
FIG. 4.
FIG. 4.
Frequencies of IFN-γ-secreting cells, as assessed by ELISPOT assay. CSFMCs and PBMCs were expanded for 2 weeks with PHA and then assessed for frequency of IFN-γ SFC to HIV-specific optimal class I peptides by ELISPOT assay. Numbers of peptides tested and numbers with IFN-γ responses are listed in Table 3. (A) Relationship between SFC frequencies among ex vivo expanded CD8+ cells from CSF and ex vivo expanded CD8+ cells from blood. (B) Relationship between SFC frequencies among ex vivo expanded CD8+ cells from CSF and unexpanded CD8+ cells from blood. The diagonal dashed line represents the line of unity. The vertical and horizontal dashed lines represent lower limits of quantitation. The P values are derived from a two-tailed Wilcoxon matched-pairs t test.
FIG. 5.
FIG. 5.
Distribution of memory markers. Cells from CSF and blood were assessed for distribution of CD45RO and CCR7 T-cell differentiation markers on CD4+, CD8+, and HIV-specific tetramer-positive cells by flow cytometry. (A) Flow cytometric plots of CD45RO and CCR7 on CD8+, CD4+, and HIV-specific tetramer-positive (B57-KF11) cells from CSF and blood of one representative participant (10027). Numbers in plots represent frequencies of cells in the quadrant as percentages of CD8+, CD4+, and tetramer-positive T cells. TCM, CD45RO+ CCR7+; TEMRO, CD45RO+ CCR7; TEMRA, CD45RO CCR7; naïve T cells, CD45RO CCR7+. (B) Relationship between the frequencies of CD45RO+ cells among CD8+, CD4+, and tetramer-positive cells from CSF and blood. (C) Relationship between the frequencies of TEMRA (CD45RO CCR7 T cells) among tetramer-positive cells from CSF and blood. CCR7 stains were done for only three participants from whom we had a sufficient number of cells (>1.0 × 10⁵) from CSF. The diagonal dashed line represents the line of unity. The P values are derived from a two-tailed Wilcoxon matched-pairs t test.

References

    1. Addo, M. M., X. G. Yu, A. Rathod, D. Cohen, R. L. Eldridge, D. Strick, M. N. Johnston, C. Corcoran, A. G. Wurcel, C. A. Fitzpatrick, M. E. Feeney, W. R. Rodriguez, N. Basgoz, R. Draenert, D. R. Stone, C. Brander, P. J. Goulder, E. S. Rosenberg, M. Altfeld, and B. D. Walker. 2003. Comprehensive epitope analysis of human immunodeficiency virus type 1 (HIV-1)-specific T-cell responses directed against the entire expressed HIV-1 genome demonstrate broadly directed responses, but no correlation to viral load. J. Virol. 772081-2092. - PMC - PubMed
    1. Altfeld, M., J. van Lunzen, N. Frahm, X. G. Yu, C. Schneider, R. L. Eldridge, M. E. Feeney, D. Meyer-Olson, H. J. Stellbrink, and B. D. Walker. 2002. Expansion of pre-existing, lymph node-localized CD8+ T cells during supervised treatment interruptions in chronic HIV-1 infection. J. Clin. Investig. 109837-843. - PMC - PubMed
    1. Baenziger, J., H. Hengartner, R. M. Zinkernagel, and G. A. Cole. 1986. Induction or prevention of immunopathological disease by cloned cytotoxic T cell lines specific for lymphocytic choriomeningitis virus. Eur. J. Immunol. 16387-393. - PubMed
    1. Bagetta, G., M. T. Corasaniti, A. M. Paoletti, L. Berliocchi, R. Nistico, A. M. Giammarioli, W. Malorni, and A. Finazzi-Agro. 1998. HIV-1 gp120-induced apoptosis in the rat neocortex involves enhanced expression of cyclo-oxygenase type 2 (COX-2). Biochem. Biophys. Res. Commun. 244819-824. - PubMed
    1. Barks, J. D., X. H. Liu, R. Sun, and F. S. Silverstein. 1997. gp120, a human immunodeficiency virus-1 coat protein, augments excitotoxic hippocampal injury in perinatal rats. Neuroscience 76397-409. - PubMed

Publication types

MeSH terms