Clinical Trial
. 2008 Nov 15;112(10):4193-201.
doi: 10.1182/blood-2008-02-134411. Epub 2008 Aug 20.

An 86-probe-set gene-expression signature predicts survival in cytogenetically normal acute myeloid leukemia

Affiliations
Clinical Trial

An 86-probe-set gene-expression signature predicts survival in cytogenetically normal acute myeloid leukemia

Klaus H Metzeler et al. Blood. .

Abstract

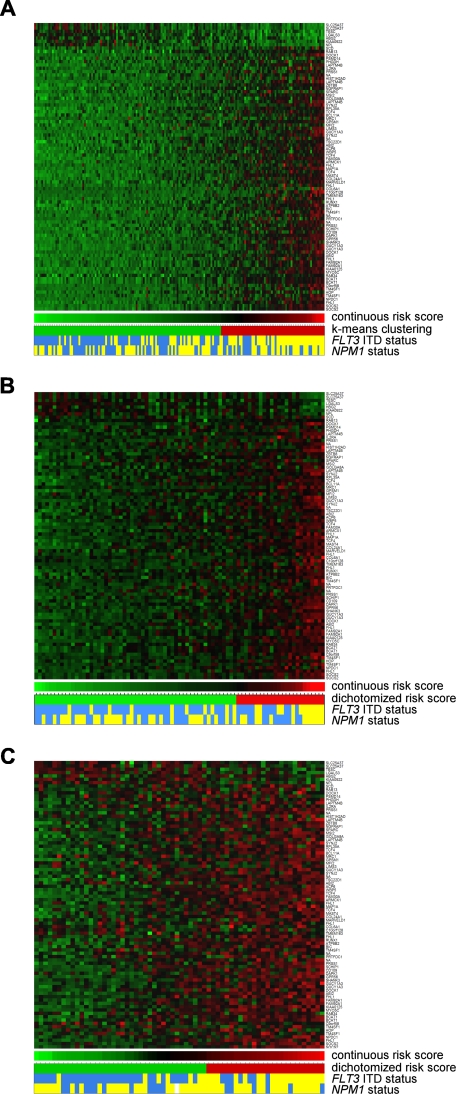
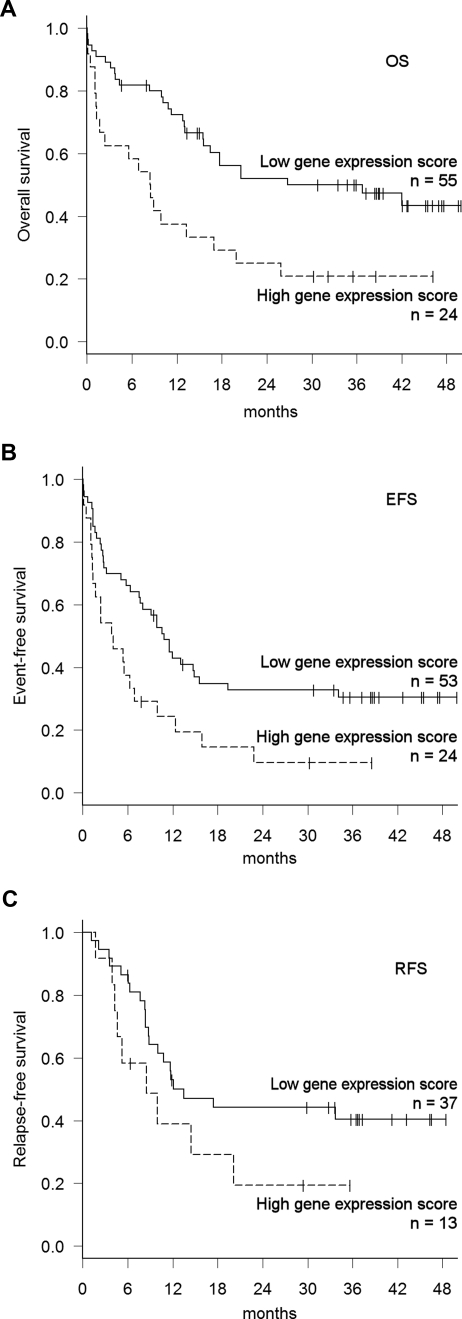
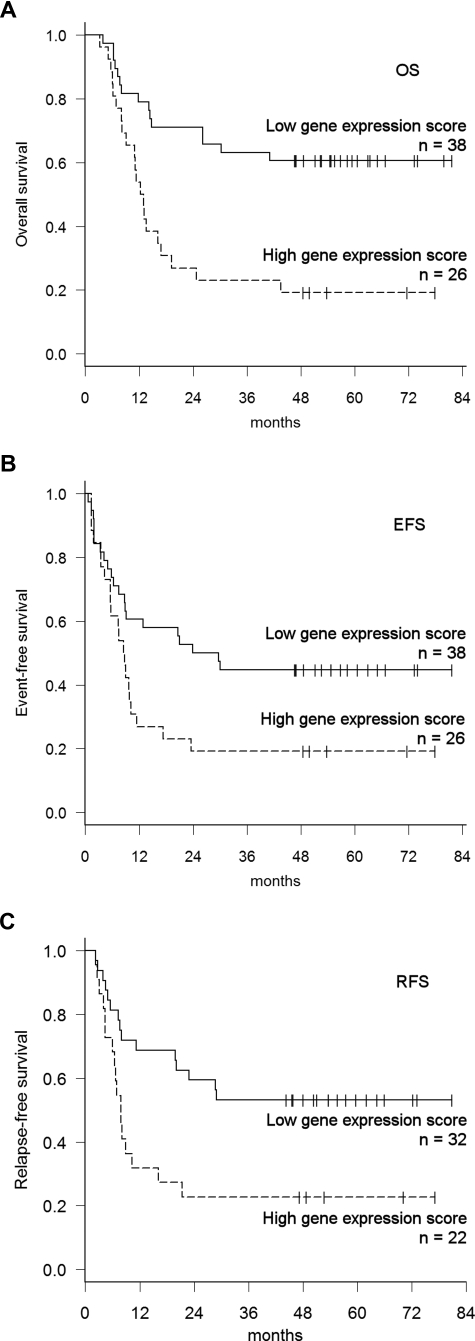
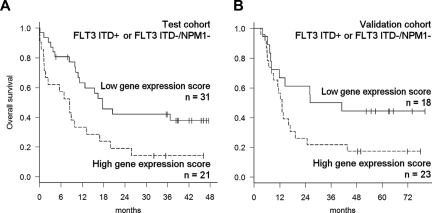
Patients with cytogenetically normal acute myeloid leukemia (CN-AML) show heterogeneous treatment outcomes. We used gene-expression profiling to develop a gene signature that predicts overall survival (OS) in CN-AML. Based on data from 163 patients treated in the German AMLCG 1999 trial and analyzed on oligonucleotide microarrays, we used supervised principal component analysis to identify 86 probe sets (representing 66 different genes), which correlated with OS, and defined a prognostic score based on this signature. When applied to an independent cohort of 79 CN-AML patients, this continuous score remained a significant predictor for OS (hazard ratio [HR], 1.85; P = .002), event-free survival (HR = 1.73; P = .001), and relapse-free survival (HR = 1.76; P = .025). It kept its prognostic value in multivariate analyses adjusting for age, FLT3 ITD, and NPM1 status. In a validation cohort of 64 CN-AML patients treated on CALGB study 9621, the score also predicted OS (HR = 4.11; P < .001), event-free survival (HR = 2.90; P < .001), and relapse-free survival (HR = 3.14, P < .001) and retained its significance in a multivariate model for OS. In summary, we present a novel gene-expression signature that offers additional prognostic information for patients with CN-AML.


Figures

Figure 1
Figure 1
Heatmaps visualizing the expression levels of the 86 probe sets used in the prognostic gene signature. The heatmaps show the relative levels of expression for the 86 probe sets in 163 patients in the training cohort (A), 79 patients in the test cohort (B), and in the 64 patients in the validation cohort (C). The probe sets are arranged according to their univariate Cox score for correlation with overall survival, with those having the highest negative score shown on top and those with the highest positive score shown at the bottom. Green spots indicate below-average expression; red spots, above-average expression. Below each heatmap, the continuous score calculated from these 86 expression values is visualized. NPM1 and FLT3 status are color-coded: A yellow mark indicates the presence of an NPM1 mutation or FLT3 ITD; blue mark, the absence of the mutation. In panel A, the 2 patient groups generated by 2-means clustering of the continuous score values are depicted in green and red. The mean of the 2 cluster centers was subsequently used as a cutoff threshold in the test and validation cohorts to allow dichotomization of the continuous risk score, as indicated in green and red in panels B and C.
Figure 2
Figure 2
Outcomes in the test dataset according to the prognostic gene-expression score. The prognostic signature was developed exclusively in the training data and then applied to the test data. For visualization of patient survival according to the gene-expression score, a cutoff value was defined in the training cohort using a k-means clustering algorithm. This threshold was then used for dichotomization of score values in the test cohort. Kaplan-Meier plots of (A) OS and (B) EFS were generated for patients with high versus low gene-expression scores. Data on EFS were available for 77 of the 79 patients in the test cohort. (C) RFS for the 50 patients in the test cohort who reached CR.
Figure 3
Figure 3
Outcome prediction in the independent validation cohort. The gene-expression risk score was calculated using the same probe set weights as in the original training and test cohorts, and the cutoff value defined in the training cohort was used for dichotomization. (A) OS and (B) EFS for the entire cohort of 64 patients. (C) RFS for the 54 patients who reached CR.
Figure 4
Figure 4
Prognostic value of the gene-expression signature in patients with high-risk molecular features. To visualize the prognostic value of the gene-expression predictor in patients who either carry a FLT3 ITD or are FLT3 ITD/NPM1, score values were dichotomized based on the cutoff value defined in the training cohort. (A) Kaplan-Meier plots of OS of molecular high-risk patients in the test cohort. (B) OS of molecular high-risk patients in the validation cohort.

References

    1. Grimwade D, Walker H, Oliver F, et al. The importance of diagnostic cytogenetics on outcome in AML: analysis of 1,612 patients entered into the MRC AML 10 trial. The Medical Research Council Adult and Children's Leukaemia Working Parties. Blood. 1998;92:2322–2333. - PubMed
    1. Mrozek K, Heerema NA, Bloomfield CD. Cytogenetics in acute leukemia. Blood Rev. 2004;18:115–136. - PubMed
    1. Mrozek K, Marcucci G, Paschka P, Whitman SP, Bloomfield CD. Clinical relevance of mutations and gene-expression changes in adult acute myeloid leukemia with normal cytogenetics: are we ready for a prognostically prioritized molecular classification? Blood. 2007;109:431–448. - PMC - PubMed
    1. Falini B, Mecucci C, Tiacci E, et al. Cytoplasmic nucleophosmin in acute myelogenous leukemia with a normal karyotype. N Engl J Med. 2005;352:254–266. - PubMed
    1. Schnittger S, Schoch C, Kern W, et al. Nucleophosmin gene mutations are predictors of favorable prognosis in acute myelogenous leukemia with a normal karyotype. Blood. 2005;106:3733–3739. - PubMed

Publication types

MeSH terms