. 2008 Aug 20;28(34):8635-43.
doi: 10.1523/JNEUROSCI.1411-08.2008.

Downregulation of dendritic I(h) in CA1 pyramidal neurons after LTP

Affiliations

Downregulation of dendritic I(h) in CA1 pyramidal neurons after LTP

Emilie Campanac et al. J Neurosci. .

Abstract

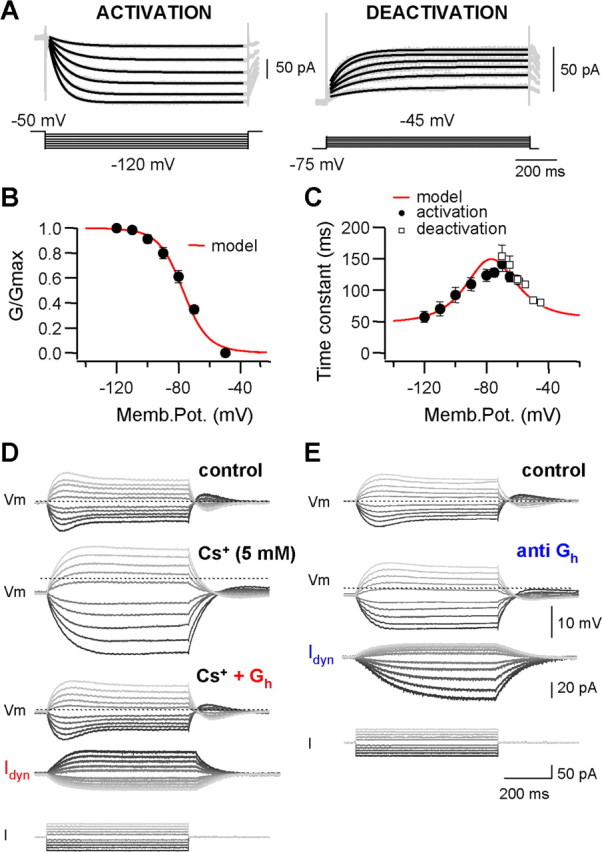
Hyperpolarization-activated (h)-channels occupy a central position in dendritic function. Although it has been demonstrated that these channels are upregulated after large depolarizations to reduce dendritic excitation, it is not clear whether they also support other forms of long-term plasticity. We show here that nearly maximal long-term potentiation (LTP) induced by theta-burst pairing produced upregulation in h-channel activity in CA1 pyramidal neurons. In contrast, moderate LTP induced by spike-timing-dependent plasticity or high-frequency stimulation (HFS) downregulated the h-current (I(h)) in the dendrites. After HFS-induced LTP, the h-conductance (G(h)) was reduced without changing its activation. Pharmacological blockade of I(h) had no effect on LTP induction, but occluded EPSP-to-spike potentiation, an input-specific facilitation of dendritic integration. Dynamic-clamp reduction of G(h) locally in the dendrite mimicked the effects of HFS and enhanced synaptic integration in an input-selective way. We conclude that dendritic I(h) is locally downregulated after induction of nonmaximal LTP, thus facilitating integration of the potentiated input.


Figures

Figure 1.
Figure 1.
Regulation of Ih depends on LTP magnitude. A, Large TBP-induced LTP (225%) is accompanied by an increase in Ih. Top graph, Time course of LTP. Bottom graph, Time course of the apparent Rin measured with a large hyperpolarizing pulse of current (−100 pA, 1 s). Middle traces, Family of voltage deflections measured at constant Vm in response to a series of current pulses (−20/−100 pA) before and 30 min after TBP. B, Moderate TBP-induced LTP (125%) is associated with a decrease in h-channel activity. Note the increase in the amplitude of the hyperpolarization after TBP (middle traces and bottom plot). C, Normalized hyperpolarization amplitude versus normalized EPSP slope for TBP, STDP, and HFS (open symbols, not significant changes). A significant linear anticorrelation was observed (y = −0.062x + 115; r = 0.41; p < 0.005). D, E-S potentiation depends on the magnitude of LTP. Normalized E-S changes as a function of synaptic potentiation are shown. Note that maximal E-S potentiation is obtained for moderate potentiation (120–140%), whereas E-S depression is consistently observed for maximal potentiation (>160%). Black squares, Mean changes in E-S coupling calculated in classes of 25%. Asterisks indicate statistically significant differences (Mann–Whitney U test, p < 0.05). Hyperpol. Ampl., Hyperpolarization amplitude.
Figure 2.
Figure 2.
Long-lasting decrease in Ih after HFS. A, Current-clamp analysis. Top, Time course of LTP in control (red) or in the presence of d-AP5 (gray). Top traces, EPSPs and representative voltage traces evoked by large hyperpolarizing pulses of current (−100/−150 pA, 0.8–1 s), before and after LTP. HFS induced LTP and enhanced the apparent Rin [superimposed traces, before (black) and after (red) HFS]. Bottom, Summary of changes in apparent Rin (left), depolarizing sag (middle), and RMP (right) (*p < 0.05; ns, p > 0.05). B, Voltage-clamp analysis. Top, Time course of the maximal conductance Gh. Representative traces showing EPSC potentiation (top traces) and reduction in Ih (bottom traces) are shown. Bottom, Normalized conductance–voltage relations before (black circles) or after (red circles) HFS. Bottom right, Filled red circles correspond to data normalized to the current evoked by a voltage step to −120 mV. Amplitudes of the h-current were measured at 800 ms. Values of Gh were fitted with Boltzmann functions. Hyp, Hyperpolarization; Hyperpol. Ampl., hyperpolarization amplitude; Memb. Pot, membrane potential.
Figure 3.
Figure 3.
Local increase in apparent Rin in the dendrite after LTP induction. A, Left, Position of recording and stimulating pipettes (inset) on the soma (S) and the dendrite (D) of a CA1 pyramidal neuron. Scale bar, 10 μm. Middle, Superimposed EPSPs before and after HFS recorded in the soma. Right, Voltage responses to hyperpolarizing current pulses injected in the dendrite (top) or the soma (bottom), before (black), and after (red) LTP induction. Note the increased apparent Rin when current is injected in the dendrite. To minimize bridge errors, voltage deflections measured with the electrode that did not inject current were normalized, and these values (underlined) were retained for further analysis. B, Left, Normalized hyperpolarization amplitude measured when the current is injected in the soma and the dendrite. Middle, Changes in sag amplitude. Right, Change in RMP. C, Plot of apparent Rin versus the EPSP slope. Note the correlation (y = −0.092x + 129.08; r = 0.47). Hyperpol. Ampl., Hyperpolarization amplitude. *p < 0.05.
Figure 4.
Figure 4.
Occlusion of E-S potentiation by Ih blockers. A, LTP (left) and E-S potentiation (right) induced by HFS (100 Hz; black triangle) in a representative slice. Dashed areas correspond to the test of E-S coupling. Right, Population spike (PS) amplitude as a function of EPSP slope before and after HFS. B, Ih blockers prevented induction of E-S potentiation but not LTP. E-S curves before (gray) and after LTP in the presence of Cs+ or ZD-7288 are shown. C, Summary of normalized EPSP slope (left) and E-S changes (right) after HFS.
Figure 5.
Figure 5.
Control of E-S coupling by h-channels. A, h-Channel blockade hyperpolarized the neuron and depressed E-S coupling. Top, Bath application of Cs+ (2.5 mm) or ZD-7288 (1 μm) depressed E-S coupling (top left) and hyperpolarized the neuron (bottom left). Right, Summary of the effect of Cs+ and ZD-7288 on E-S coupling (n = 9) and on the resting membrane potential. B, h-Channel blockade enhanced E-S coupling at constant potential. When the potential at the cell body was kept constant with DC current injection, Cs+ or ZD-7288 enhanced the E-S coupling (n = 6). C, Local perfusion of Cs+ was able to decrease Ih without affecting the RMP measured at the soma. Left, Cs+ application was visualized with Alexa568 (100 μm). The pipette filled with Cs-Alexa was positioned on the surface of the slice at 60–100 μm from the soma, and the diameter of the Cs-Alexa stream was estimated to be ∼60–70 μm. Right, Changes in RMP and in apparent input resistance. The amplitude of the sag was decreased by −0.3 ± 0.1 mV (n = 6). No change in the amplitude of the hyperpolarization (Hyperpol. Ampl.) was observed when the external saline was applied. Rec., Recording electrode; Str. Rad., stratum radiatum.
Figure 6.
Figure 6.
Characterization of Ih in CA1 pyramidal neurons and modeling. A, Currents were isolated after subtracting control currents from those generated in the presence of ZD-7288 (see Materials and Methods). Left, h-Channels were activated by holding the cell at −50 mV and stepping to −120 mV with 10 mV increments. Currents generated were well fitted with a monoexponential function (black lines). Right, Deactivation of h-channels was studied in neurons held at −75 mV by stepping to −45 mV with 5 mV increments. The data were also well fitted with a monoexponential function. B, Normalized conductance–voltage (G–V) relation was estimated from the currents shown in A. The modeled activation curve is represented in red. C, The mean activation (filled circles) and deactivation (open squares) time constants plotted against the membrane potential. D, E, Validation of the model with the fast dynamic-clamp technique. CA1 pyramidal cells were recorded in the whole-cell configuration. Families of voltage traces evoked by depolarizing and hyperpolarizing pulses of current (+50/−50 pA) were recorded in different conditions: control (top) and in the presence of Cs+ (D, middle), Cs+ and dynamic Gh (D, bottom), or dynamic anti-Gh (E, bottom). The respective families of dynamic currents are illustrated below (Idyn). Memb. Pot., Membrane potential.
Figure 7.
Figure 7.
Dynamic-clamp reduction of dendritic Gh mimics E-S potentiation. A, Top left, Recording configuration: dual soma–dendrite whole-cell recording. The anti-Gh was injected through the dendritic electrode (D), whereas E-S coupling was evaluated with the somatic electrode (S). Bottom left, Control (black) and anti-Gh (purple) traces recorded at D and S. Right, Effects of anti-Gh on apparent Rin, sag, and RMP (n = 5). B, Dendritic anti-Gh produced E-S potentiation. Firing probability versus EPSP slope in control (black) and with dendritic anti-Gh (purple) is shown. C, Summary of the effects of dendritic anti-Gh on E-S coupling. D, Recording configuration to test input specific facilitation in synaptic integration induced by injection of anti-Gh in the dendrite of a CA1 pyramidal neuron. E, Normalized EPSP integral for each input when anti-Gh was injected. The change in the control input (St1) was always smaller than in the test input (St2). Hyperpol. Ampl., Hyperpolarization amplitude. *p < 0.05.

References

    1. Abraham WC, Gustafsson B, Wigström H. Long-term potentiation involves enhanced excitation relative to synaptic inhibition in guinea-pig hippocampus. J Physiol. 1987;394:367–380. - PMC - PubMed
    1. Abraham WC, Logan B, Greenwood JM, Dragunow M. Induction and experience-dependent consolidation of stable long-term potentiation lasting months in the hippocampus. J Neurosci. 2002;22:9626–9634. - PMC - PubMed
    1. Andersen P. Synaptic integration in hippocampal CA1 pyramids. Prog Brain Res. 1990;83:215–222. - PubMed
    1. Andersen P, Sundberg SH, Sveen O, Swann JW, Wigström H. Possible mechanisms for long-lasting potentiation of synaptic transmission in hippocampal slices from guinea-pigs. J Physiol. 1980;302:463–482. - PMC - PubMed
    1. Asztely F, Gustafsson B. Dissociation between long-term potentiation and associated changes in field EPSP waveform in the hippocampal CA1 region: an in vitro study in guinea pig brain slices. Hippocampus. 1994;4:148–156. - PubMed

Publication types

LinkOut - more resources