. 2008 Aug 13;3(8):e2933.
doi: 10.1371/journal.pone.0002933.

A fluorescent glycolipid-binding peptide probe traces cholesterol dependent microdomain-derived trafficking pathways

Affiliations

A fluorescent glycolipid-binding peptide probe traces cholesterol dependent microdomain-derived trafficking pathways

Steffen Steinert et al. PLoS One. .

Abstract

Background: The uptake and intracellular trafficking of sphingolipids, which self-associate into plasma membrane microdomains, is associated with many pathological conditions, including viral and toxin infection, lipid storage disease, and neurodegenerative disease. However, the means available to label the trafficking pathways of sphingolipids in live cells are extremely limited. In order to address this problem, we have developed an exogenous, non-toxic probe consisting of a 25-amino acid sphingolipid binding domain, the SBD, derived from the amyloid peptide Abeta, and conjugated by a neutral linker with an organic fluorophore. The current work presents the characterization of the sphingolipid binding and live cell trafficking of this novel probe, the SBD peptide. SBD was the name given to a motif originally recognized by Fantini et al in a number of glycolipid-associated proteins, and was proposed to interact with sphingolipids in membrane microdomains.

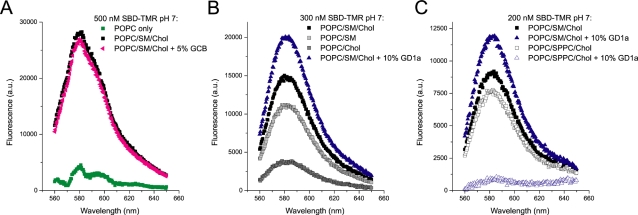
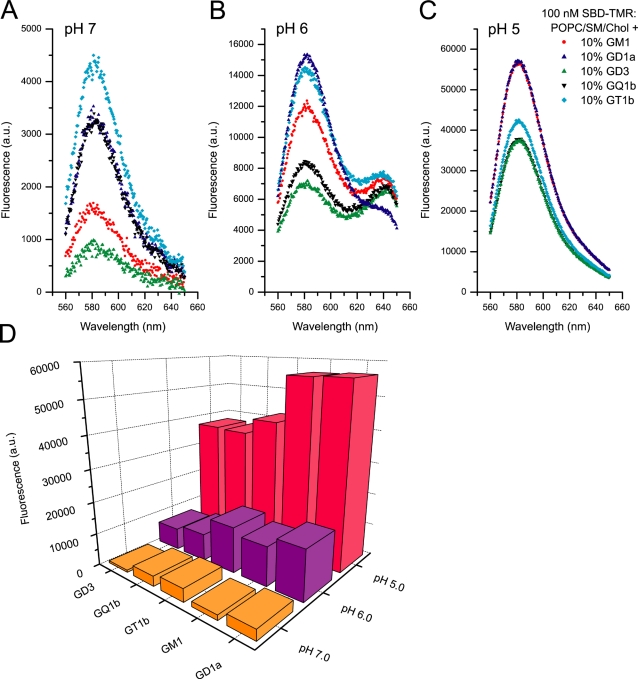
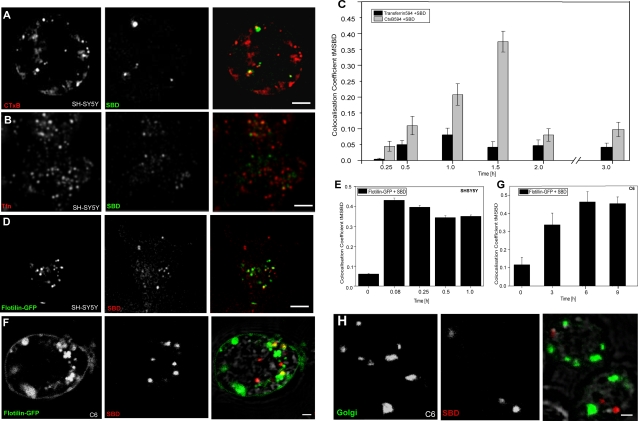
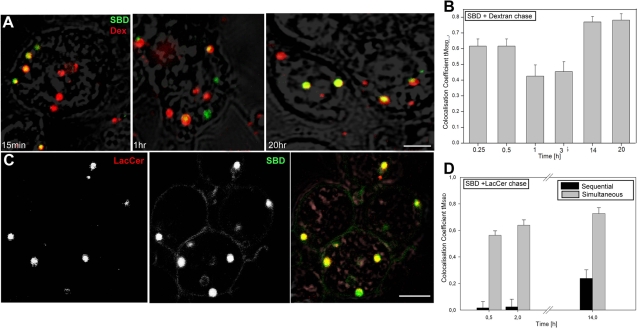
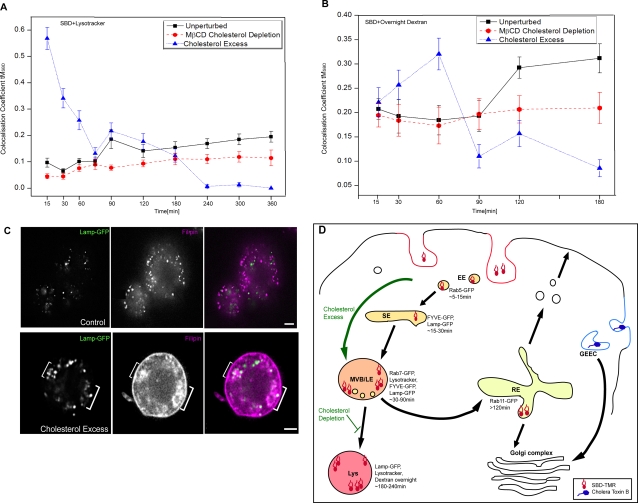
Methodology/principal findings: In accordance with Fantini's model, optimal SBD binding to membranes depends on the presence of sphingolipids and cholesterol. In synthetic membrane binding assays, SBD interacts preferentially with raft-like lipid mixtures containing sphingomyelin, cholesterol, and complex gangliosides in a pH-dependent manner, but is less glycolipid-specific than Cholera toxin B (CtxB). Using quantitative time-course colocalization in live cells, we show that the uptake and intracellular trafficking route of SBD is unlike that of either the non-raft marker Transferrin or the raft markers CtxB and Flotillin2-GFP. However, SBD traverses an endolysosomal route that partially intersects with raft-associated pathways, with a major portion being diverted at a late time point to rab11-positive recycling endosomes. Trafficking of SBD to acidified compartments is strongly disrupted by cholesterol perturbations, consistent with the regulation of sphingolipid trafficking by cholesterol.

Conclusions/significance: The current work presents the characterization and trafficking behavior of a novel sphingolipid-binding fluorescent probe, the SBD peptide. We show that SBD binding to membranes is dependent on the presence of cholesterol, sphingomyelin, and complex glycolipids. In addition, SBD targeting through the endolysosomal pathway in neurons is highly sensitive to cholesterol perturbations, making it a potentially useful tool for the analysis of sphingolipid trafficking in disease models that involve changes in cholesterol metabolism and storage.


Conflict of interest statement

Competing Interests: The authors have declared that no competing interests exist.

Figures

Figure 1
Figure 1. SBD binds to and is internalized by insect and mammalian cells.
A. Sequences of the SBD, SBD*, and SBDscr peptides with amino-terminal Cysteine and AEEAc spacer. For SBD-TMR, the fluorophore was conjugated directly via amine linkage to the spacer. B. Drosophila c6 neuronal cells labelled with SBD-, SBD*-, or SBDscr-Oregon Green (conjugated with SBD at the terminal Cysteine) at 10 uM in HBSS for 15 min at 25°C. Wild type SBD shows internalized punctae representative of endocytic domains, whereas the number and intensity of punctae in SBD* and SBDscr are much reduced. C. Mouse NIH3T3 fibroblasts labelled with SBD-OG or SBD*-OG at 2 µM in HBSS for 15 min at 37°C. Scalebar in B = 5 µm; in C = 10 µm.
Figure 2
Figure 2. SBD binds preferentially to glycolipid-containing liposomes with raft-like composition.
A. Fluorescence retained on liposomes of different composition after binding SBD-TMR to liposomes and filter-separation of unbound probe. SBD-TMR was retained much more strongly on liposomes containing the raft-like mixture of POPC∶SM∶Ch (45∶25∶30) (black squares) than on liposomes composed only of POPC (green boxes). Addition of 5% GCB (pink triangles), did not improve binding. B. A POPC/Chol (45∶55) mixture (dark gray boxes) showed the lowest binding capacity, whereas a POPC/SM (45∶55) mixture bound with intermediate affinity (light gray boxes). This was further improved by the presence of cholesterol (black boxes) and 10% GD1a (blue triangles). C. SBD shows some binding to the saturated glycerophospholipid SPPC, when substituted for SM in the basic raft mixture (POPC∶SPPC∶Ch 45∶25∶30) (white boxes). Unlike SM containing rafts, however, binding is abolished by addition of 10% GD1a (blue empty triangles). In all graphs, background fluorescence in the absence of liposomes, (e.g. due to possible retention of SBD in aggregated form) was subtracted. In POPC/SM/Chol liposomes, background fluorescence accounted for ∼25% of total signal.
Figure 3
Figure 3. SPR (A–C) and spectrofluorimetric (D–F) binding assays of SBD-TMR to a POPC/SM/Chol (45∶25∶30 mol%) mixture show that a high concentration of ganglioside (10–20%) is required for optimal binding, by comparison with CtxB to its target, GM1 (C, F).
A, B. Both non-fluorescently coupled SBD (A) and SBD-TMR (20 µM) (B) bind more strongly to 20% GD1a-containing POPC/SM/Chol liposomes immobilized on a Dextran-coated L1 sensorchip. C. CtxB-Alexa488, in contrast to SBD, binds at a lower concentration (200 nM) with significantly higher affinity. After the injection, CtxB showed nearly no dissociation from the liposome substrate, as indicated by a continued high response level. D, E. Comparison between SBD-TMR (500 nM) binding to POPC/SM/Chol liposomes containing no ganglioside (black ▪) vs. GM1 (red •) or GD1a (blue ▴), at 10% or 5% (D, E respectively) by spectrofluorimetric assay. F. Similar liposome assay as in D, E, with 100 nM of CtxB-Alexa binding to POPC/SM/Chol liposomes with no ganglioside (black ▪) vs. 5% GD1a (blue ▴) or 5% of GM1 (red •). For spectrofluorimetric curves (D–F), the background fluorescence in the absence of liposomes was substracted.
Figure 4
Figure 4. SBD preference for particular gangliosides depends on pH, and interaction with raft-ganglioside mixtures is strongly enhanced at low pH.
Spectrofluorimetric liposome binding assay of 100 nM of SBD-TMR with the raft-like ternary mixture POPC/SM/Chol (45∶25∶30 mol%). 10% of the given ganglioside was incorporated into the lipid membrane: GM1 (red •), GD1a (blue ▴), GD3 (green ▴), GQ1b (black ▾) and GT1b (cyan ♦). A, B and C are the fluorescence spectra taken at pH 7, 6 and 5 respectively. D summarizes the comparative fluorescence responses at 580 nm for the various gangliosides at different pH.
Figure 5
Figure 5. SBD trafficking converges to differing extents over time with lipid raft markers CtxB and Flotillin-GFP, but not with clathrin-uptake marker Transferrin or Golgi.
A. Colocalization of CtxB and SBD in SH-SY5Y neuroblastomas. CtxB-Alexa546 (red) was incubated for 30 min in growth medium at 37°C, washed, then cross-linked with anti-CtxB (Vybrant, Invitrogen) for 15 min in growth medium at 37°C, and washed. SBD-OG (green) was incubated immediately thereafter at 5 µM in growth medium for 10 min at 37°C. Both labels were chased in phenol-red-free growth medium and imaged at the time-points given in graph (C). B. SBD does not colocalize with Transferrin (Tfn)-Alexa594, a marker of clathrin-mediated uptake, in SH-SY5Y neuroblastomas. Cells were labelled with Tfn-Alexa594 (10 µg/ml) for 30 min at 37°C, washed, and incubated with SBD-OG (5 µM) for 10 min at 37°C, both in growth medium. Scale bar = 5 µm for A, B, D. C. Colocalization time-course of SBD-OG with CtxB (gray bars) and Tfn-Alexa594 (black bars) in SH-SY5Y neuroblastomas. D. Flotillin2-GFP expressing SH-SY5Y neuroblastomas (green) were labeled 24h after transfection with SBD-TMR as in (A). E. Quantification of Flotillin2-GFP vs. SBD-TMR in SH-SY5Y. F. Flotillin2-GFP expressing c6 cells (green) were labeled 24h after transfection with SBD-TMR (10 µM) in growth medium for 15 min at 25°C. SBD-TMR (red) uptake vesicles are distinct from Flotillin2-GFP vesicles in c6 cells, but increase in colocalization over time (graph in G). Cells were imaged between 60–90 min after application of labels in A–F. Scale bar = 2 µm. G. Quantification of Flotillin2-GFP vs. SBD-TMR in c6 cells. H. SBD shows virtually no accumulation in the Golgi body in c6 cells. C6 cells were labelled as above with SBD-TMR, chased, fixed, and stained with an anti-Drosophila Golgi antibody (Merck). Scale bar = 2 µm.
Figure 6
Figure 6. Pulsed SBD-TMR traffics sequentially via rab5-, rab7-, and FYVE-positive vesicles to rab11 recycling endosomes in c6 cells.
A, B. SBD colocalizes maximally with rab5-GFP positive early endosomes between 15 and 30 min. Cells were imaged 30 min after application of SBD. C, D. SBD colocalizes maximally with FYVE-GFP positive sorting and multivesicular endosomes between 30 min and 2 h. E, F. SBD colocalization with rab7-GFP positive late endosomes peaks at 1 h. G, H. SBD colocalizes strongly with rab11-GFP positive recycling endosomes only later, at 3 h. For all labellings, SBD-TMR (10 µM in growth medium) was incubated at 25°C for 10 min on cells that had been transfected with the indicated constructs 24–40 h earlier. Cells were imaged at 60 min after application of SBD-TMR in C, E, and G.
Figure 7
Figure 7. SBD traffics slowly to endolysosomes in c6 cells (A–E) and is found in lysotracker-positive compartments of mammalian neurons (G, H).
A, B. Pulsed SBD-OG (green) (incubated at 5 µM in growth medium at 25°C for 10 min) reaches Dextran-Alexa670 (0.5 mg/ml; red) labelled late endolysosomal compartments maximally after 2 h of chase in growth medium. C, D. SBD-TMR (red), incubated at 10 µM in growth medium 24 h after transfection with LAMP-GFP (green) colocalizes maximally in presumptive sorting and late endosomal compartments, up to 2 h of chase in growth medium. E, F. SBD-OG (green) (incubated as in A, B) colocalization with lysotracker (red) (incubated at 75 nM 2 h at 25°C) peaks transiently in a late endosomal compartment (2 h) before reaching a moderate maximum (∼20%) only after 5–7 h (see control graph in fig. 7A). Cells were imaged between 60–90 min after application of SBD in A–E. G, H. SBD-OG (green; incubated at 2 µM for 15 min at 37°C) also colocalizes extensively with lysotracker in SH-SY5Y neuroblastomas, and in mouse primary cortical neurons, shown at 60 min after application of SBD (incubated at 75 nM 2 h at 37°C for both; movie of neuroblastomas shown in fig. S3). I–L. Relative distributions of different endolysosomal markers in c6 cells. (I) Lysotracker (red; labelled as in E) and Dextran-Alexa488 (incubated at 0.5 mg/ml for 5 min at 25°C) chased overnight (green) colocalize ∼75% (L), but some Dextran vesicles are not acidic, indicated by the absence of lysotracker (arrowhead). J. Pulsed Dextran-Alexa670 (incubated as in I, 24 h after transfection) colocalizes with LAMP-GFP throughout its trajectory, reaching maximum tM ∼45% (also see Sriram et al, 2003). K, L. Transfected LAMP-GFP labels both acidic and non-acidic vesicles, as judged by substantial non-colocalization with lysotracker-red (incubated as in E). Scalebar in all images = 5 µm.
Figure 8
Figure 8. SBD-OG traffics similarly to pulsed Dextran-Alexa670 and lactosyl-ceramide when both labels are present simultaneously at the plasma membrane.
A, B. SBD-OG follows a similar pathway to Dextran-Alexa670 (shown after 15′, 1 h, and 20 h), but appears to diverge transiently in post-sorting late endosomes between ∼60 min and 3 h (see movie S3). Cells were incubated first with SBD-OG at 5 uM in HBSS for 15 min at 25°C, washed once, and incubated in Dextran-Alexa670 at 0.5 mg/ml in HBSS for 5 min, washed, chased in HBSS, then imaged at the time-points given in the graph (B). C, D. BODIPY-lac-cer (red) shows nearly complete colocalization with SBD-OG (green) when incubated simultaneously on c6 neurons (gray bars; see Methods). Sequential incubation (black bars) leads to much lower colocalization scores. Even after 14 h, colocalization levels never approach those attained with simultaneous incubation, indicating an altered trafficking route taken by at least one of the two labels. For simultaneous SBD/lactosyl-Ceramide labellings, cells were incubated with lactosyl-Ceramide (5 mM at 4°C for 30 min, washed once, incubated with SBD-OG (25°C as in A), chased in HBSS, and imaged at the time-points given in graph (D). For sequential labellings, cells were incubated with BODIPY-lac-cer at 25°C, washed several times in warmed HBSS to allow uptake, then incubated with the second label (SBD-OG) at physiological temperature (concentrations as above), washed in HBSS, and chased in growth medium. Scalebar = 5 µm.
Figure 9
Figure 9. SBD trafficking to acidic organelles is sensitive to cholesterol levels.
A. C6 cells depleted of cholesterol with MβCD (10 mM 30 min 25°C; red circles) or treated with excess cholesterol (10 mM MβCD-10mM cholesterol complexes for 30 min 25°C; blue triangles), or untreated (black squares), then labeled with lysotracker and pulsed with SBD-OG. Colocalization (tMSBD) was calculated at the given time points of chase. Data for control untreated cells were compiled from two experiments. B. C6 cells were labeled with Dextran-Alexa488 overnight, and then depleted of cholesterol (red circles), or treated with excess cholesterol as in (A)(blue triangles), or untreated (black squares) and labeled with SBD-TMR, as in fig. 5F. Colocalization was calculated at the given time points of chase. C. Control c6 cells (top panels), or c6 treated with excess cholesterol (bottom panels) after transfection with LAMP-GFP (green) and subsequent fixation show heavy accumulations of filipin (pink) at the plasma membrane and near, but not exclusively in, endolysosomal compartments (brackets). Total cholesterol content after cholesterol overloading was increased by 250%, ±13% (n = 3; quantification by Amplex Red enzymatic assay not shown). Scale bars for all images = 5 µm. D. Schematic representation of the internalization pathway of fluorescent SBD (red shapes) vs. another lipid-raft associated cargo, CtxB (blue hexagons), which is taken up by the GEEC pathway . Cholesterol depletion moderately inhibited transport of SBD through a Dextran-positive lysosomal compartment (>90 min in graph B), whereas cholesterol excess led to premature accumulation and then clearing of SBD from lysotracker- and Dextran-positive acidic compartments. Detection of myc immunoreactivity indicates that internalized SBD-myc has not been degraded. Dot blots were also exposed to anti-β-tubulin as a loading control to ensure that protein amounts were comparable in the various sets. Intensity of dots was quantified using Quantity One software and represented in bar graphs.

References

    1. Fantini J. How sphingolipids bind and shape proteins: molecular basis of lipid-protein interactions in lipid shells, rafts and related biomembrane domains. Cell Mol Life Sci. 2003;60:1027–1032. - PMC - PubMed
    1. Munro S. Lipid rafts: elusive or illusive? Cell. 2003;115:377–388. - PubMed
    1. Edidin M. The state of lipid rafts: from model membranes to cells. Annu Rev Biophys Biomol Struct. 2003;32:257–283. - PubMed
    1. Brown DA, London E. Structure and function of sphingolipid- and cholesterol-rich membrane rafts. J Biol Chem. 2000;275:17221–17224. - PubMed
    1. Simons K, Ikonen E. Functional rafts in cell membranes. Nature. 1997;387:569–572. - PubMed

Publication types

LinkOut - more resources