. 2008 Jun;19(6):382-9.
doi: 10.1007/s00335-008-9135-8. Epub 2008 Aug 21.

The Collaborative Cross at Oak Ridge National Laboratory: developing a powerful resource for systems genetics

Affiliations

The Collaborative Cross at Oak Ridge National Laboratory: developing a powerful resource for systems genetics

Elissa J Chesler et al. Mamm Genome. 2008 Jun.

Abstract

Complex traits and disease comorbidity in humans and in model organisms are the result of naturally occurring polymorphisms that interact with each other and with the environment. To ensure the availability of resources needed to investigate biomolecular networks and systems-level phenotypes underlying complex traits, we have initiated breeding of a new genetic reference population of mice, the Collaborative Cross. This population has been designed to optimally support systems genetics analysis. Its novel and important features include a high level of genetic diversity, a large population size to ensure sufficient power in high-dimensional studies, and high mapping precision through accumulation of independent recombination events. Implementation of the Collaborative Cross has been ongoing at the Oak Ridge National Laboratory (ORNL) since May 2005. Production has been systematically managed using a software-assisted breeding program with fully traceable lineages, performed in a controlled environment. Currently, there are 650 lines in production, and close to 200 lines are now beyond their seventh generation of inbreeding. Retired breeders enter a high-throughput phenotyping protocol and DNA samples are banked for analyses of recombination history, allele drift and loss, and population structure. Herein we present a progress report of the Collaborative Cross breeding program at ORNL and a description of the kinds of investigations that this resource will support.


Figures

Fig. 1
Fig. 1
Birth records of all CC mice born in the ORNL colony. Each mouse is represented by a single bar. Two groups of lines have been started at ORNL. The first, consisting of 474 started lines, is approaching G2:F12. The second is in the initiation phases. Time to fertility is gradually slowing to a typical pace for inbred lines. This display can be regenerated at http://mouse.ornl.gov/projects/ cc_breeding_progress.html
Fig. 2
Fig. 2
A depiction of the Collaborative Cross funnel design showing the progenitor source of autosomal, sex chromosomal, and mitochondrial DNA. The strain in the A position contributes the mitochondrial DNA, and the strain in the H position contributes the Y chromosome. X chromosomal DNA in finished line comes from strains in the A, B, C, E, and F positions
Fig. 3
Fig. 3
Visual representation of a completely traceable funnel in CCDB. This display shows funnel #55 and its reciprocal #232. The gray highlight indicates the mating cage that was randomly chosen to produce the next generation
Fig. 4
Fig. 4
Summary of ORNL funnels generated to date. The solid line indicates the total number of funnels that have reached the given generation, and the dotted line reveals the maximum number of funnels that can potentially be reached at this time based on a projection of the current number of extant funnels. Some loss is anticipated. The two subgroups of lines have been separated. Infertile G1 s are not represented
Fig. 5
Fig. 5
Estimate of heterozygosity within the CC. This figure shows the mean estimated identical by descent allele frequency at each generation in 10,000 simulated CC lines
Fig. 6
Fig. 6
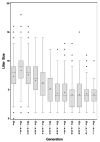
CC funnel litter size by generation. Litter sizes have reached an asymptote at approximately 4, which is typical for RI lines
Fig. 7
Fig. 7
MouseTrack calculation and display of heritability of two complex phenotypes, fasting plasma glucose, and behavioral wildness (Wahlsten et al. 2003) through seven generations of inbreeding of the Collaborative Cross

References

    1. Baker EJ, Galloway L, Jackson B, Schmoyer D, Snoddy J. MuTrack: a genome analysis system for large-scale mutagenesis in the mouse. BMC Bioinformatics. 2004;5:11. - PMC - PubMed
    1. Broman KW. The genomes of recombinant inbred lines. Genetics. 2005;169(2):1133–1146. - PMC - PubMed
    1. Churchill GA, Airey DC, Allayee H, Angel JM, Attie AD, et al. The Collaborative Cross, a community resource for the genetic analysis of complex traits. Nat Genet. 2004;36(11):1133–1137. - PubMed
    1. Kelmenson PM, Petkov P, Wang X, Higgins DC, Paigen BJ, et al. A torrid zone on mouse chromosome 1 containing a cluster of recombinational hotspots. Genetics. 2005;169(2):833–841. - PMC - PubMed
    1. Mott R, Talbot CJ, Turri MG, Collins AC, Flint J. A method for fine mapping quantitative trait loci in outbred animal stocks. Proc Natl Acad Sci USA. 2000;97(23):12649–12654. - PMC - PubMed

Publication types