

Increased deposition of C3b on red cells with low CR1 and CD55 in a malaria-endemic region of western Kenya: implications for the development of severe anemia
- PMID: 18717995
- PMCID: PMC2562382
- DOI: 10.1186/1741-7015-6-23
Increased deposition of C3b on red cells with low CR1 and CD55 in a malaria-endemic region of western Kenya: implications for the development of severe anemia
Abstract
Background: Severe anemia due to Plasmodium falciparum malaria is a major cause of mortality among young children in western Kenya. The factors that lead to the age-specific incidence of this anemia are unknown. Previous studies have shown an age-related expression of red cell complement regulatory proteins, which protect erythrocytes from autologous complement attack and destruction. Our primary objective was to determine whether in a malaria-endemic area red cells with low levels of complement regulatory proteins are at increased risk for complement (C3b) deposition in vivo. Secondarily, we studied the relationship between red cell complement regulatory protein levels and hemoglobin levels.
Methods: Three hundred and forty-two life-long residents of a malaria-holoendemic region of western Kenya were enrolled in a cross-sectional study and stratified by age. We measured red cell C3b, CR1, CD55, and immune complex binding capacity by flow cytometry. Individuals who were positive for malaria were treated and blood was collected when they were free of parasitemia. Analysis of variance was used to identify independent variables associated with the %C3b-positive red cells and the hemoglobin level.
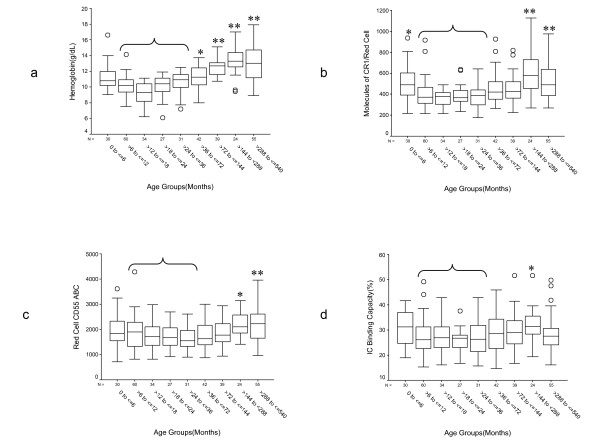
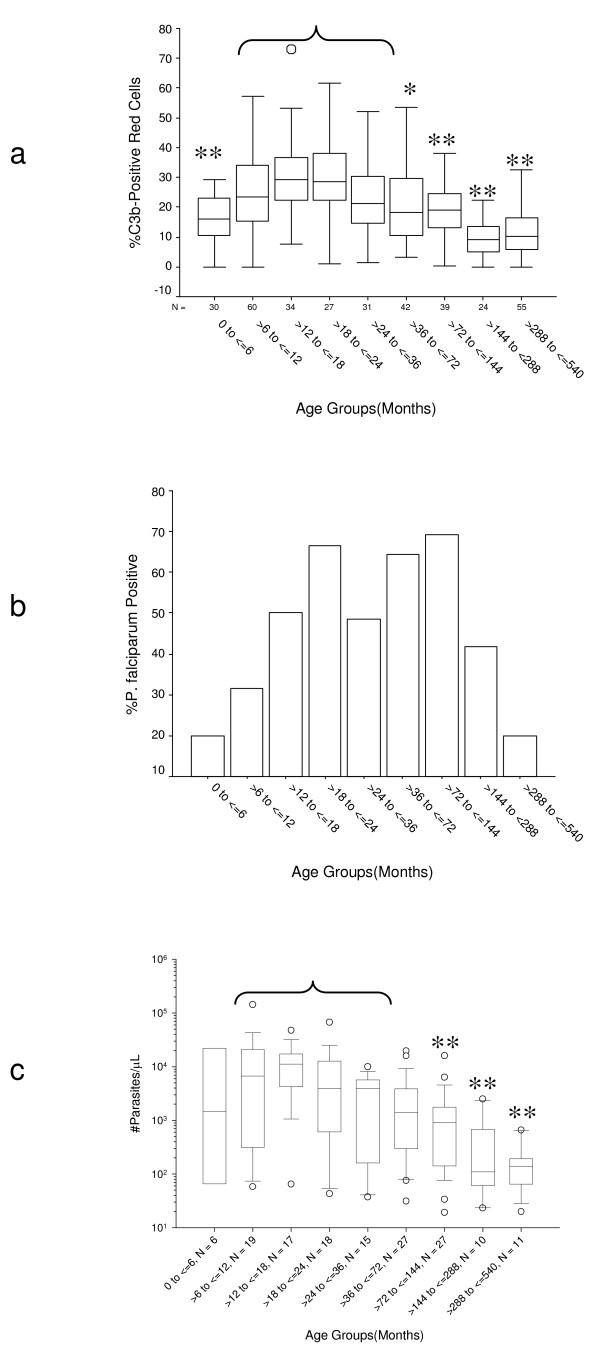
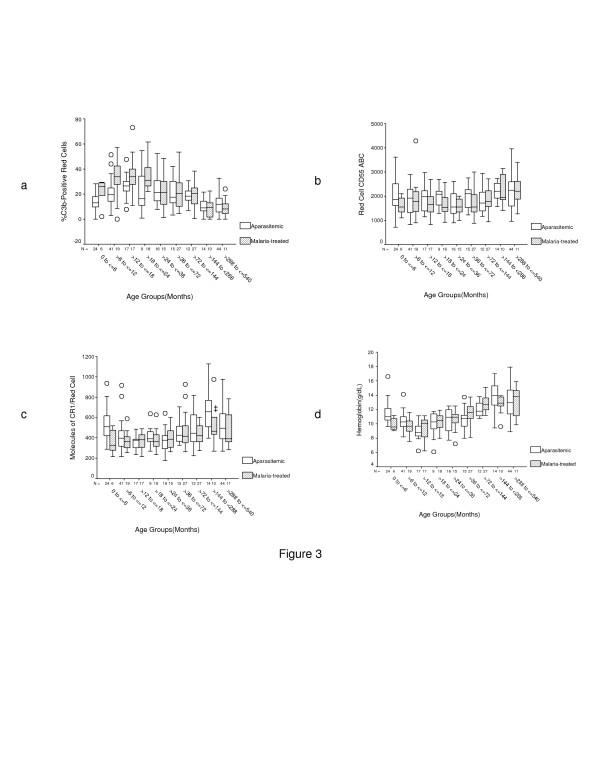
Results: Individuals between the ages of 6 and 36 months had the lowest red cell CR1, highest %C3b-positive red cells, and highest parasite density. Malaria prevalence also reached its peak within this age group. Among children </= 24 months of age the %C3b-positive red cells was usually higher in individuals who were treated for malaria than in uninfected individuals with similarly low red cell CR1 and CD55. The variables that most strongly influenced the %C3b-positive red cells were age, malaria status, and red cell CD55 level. Although it did not reach statistical significance, red cell CR1 was more important than red cell CD55 among individuals treated for malaria. The variables that most strongly influenced the hemoglobin level were age, the %C3b-positive red cells, red cell CR1, and red cell CD55.
Conclusion: Increasing malaria prevalence among children >6 to <or= 36 months of age in western Kenya, together with low red cell CR1 and CD55 levels, results in increased C3b deposition on red cells and low hemoglobin. The strong contribution of age to C3b deposition suggests that there are still additional unidentified age-related factors that increase the susceptibility of red cells to C3b deposition and destruction.
Figures
Similar articles
-
Reduced immune complex binding capacity and increased complement susceptibility of red cells from children with severe malaria-associated anemia.Mol Med. 2008 Mar-Apr;14(3-4):89-97. doi: 10.2119/2007-00093.Owuor. Mol Med. 2008. PMID: 18317566 Free PMC article.
-
Complement activation in Ghanaian children with severe Plasmodium falciparum malaria.Malar J. 2007 Dec 17;6:165. doi: 10.1186/1475-2875-6-165. Malar J. 2007. PMID: 18086298 Free PMC article.
-
Anaemia & expression levels of CD35, CD55 & CD59 on red blood cells in Plasmodium falciparum malaria patients from India.Indian J Med Res. 2011 Jun;133(6):662-4. Indian J Med Res. 2011. PMID: 21727667 Free PMC article.
-
Complement-regulatory proteins in severe malaria: too little or too much of a good thing?Trends Parasitol. 2005 May;21(5):218-23. doi: 10.1016/j.pt.2005.03.004. Trends Parasitol. 2005. PMID: 15837610 Review.
-
Beyond Hemoglobin: Screening for Malaria Host Factors.Trends Genet. 2018 Feb;34(2):133-141. doi: 10.1016/j.tig.2017.11.004. Epub 2017 Dec 14. Trends Genet. 2018. PMID: 29249333 Free PMC article. Review.
Cited by
-
C1 inhibitor in canine intravascular hemolysis (C1INCH): study protocol for a randomized controlled trial.BMC Vet Res. 2019 Dec 30;15(1):475. doi: 10.1186/s12917-019-2220-2. BMC Vet Res. 2019. PMID: 31888626 Free PMC article.
-
Loss of complement regulatory proteins on uninfected erythrocytes in vivax and falciparum malaria anemia.JCI Insight. 2018 Nov 15;3(22):e124854. doi: 10.1172/jci.insight.124854. JCI Insight. 2018. PMID: 30429373 Free PMC article.
-
Loss of complement regulatory proteins on red blood cells in mild malarial anaemia and in Plasmodium falciparum induced blood-stage infection.Malar J. 2019 Sep 18;18(1):312. doi: 10.1186/s12936-019-2962-0. Malar J. 2019. PMID: 31533836 Free PMC article.
-
The role of decay accelerating factor in environmentally induced and idiopathic systemic autoimmune disease.Autoimmune Dis. 2014;2014:452853. doi: 10.1155/2014/452853. Epub 2014 Jan 27. Autoimmune Dis. 2014. PMID: 24592327 Free PMC article. Review.
-
Paroxysmal Nocturnal Haemoglobinuria Masquerading as Malaria: A Case Report.J Clin Diagn Res. 2015 Aug;9(8):OD03-4. doi: 10.7860/JCDR/2015/13465.6329. Epub 2015 Aug 1. J Clin Diagn Res. 2015. PMID: 26435988 Free PMC article.
References
-
- Breman JG. The ears of the hippopotamus: manifestations, determinants, and estimates of the malaria burden. Am J Trop Med Hyg. 2001;64:1–11. - PubMed
-
- Modiano D, Sirima BS, Sawadogo A, Sanou I, Pare J, Konate A, Pagnoni F. Severe malaria in Burkina Faso: influence of age and transmission level on clinical presentation. Am J Trop Med Hyg. 1998;59:539–542. - PubMed
-
- Marsh K, Snow RW. Malaria transmission and morbidity. Parassitologia. 1999;41:241–246. - PubMed
Publication types
MeSH terms
Substances
Grants and funding
LinkOut - more resources
Full Text Sources
Medical
Miscellaneous
