

Spatial prediction of Plasmodium falciparum prevalence in Somalia
- PMID: 18717998
- PMCID: PMC2531188
- DOI: 10.1186/1475-2875-7-159
Spatial prediction of Plasmodium falciparum prevalence in Somalia
Abstract
Background: Maps of malaria distribution are vital for optimal allocation of resources for anti-malarial activities. There is a lack of reliable contemporary malaria maps in endemic countries in sub-Saharan Africa. This problem is particularly acute in low malaria transmission countries such as those located in the horn of Africa.
Methods: Data from a national malaria cluster sample survey in 2005 and routine cluster surveys in 2007 were assembled for Somalia. Rapid diagnostic tests were used to examine the presence of Plasmodium falciparum parasites in finger-prick blood samples obtained from individuals across all age-groups. Bayesian geostatistical models, with environmental and survey covariates, were used to predict continuous maps of malaria prevalence across Somalia and to define the uncertainty associated with the predictions.
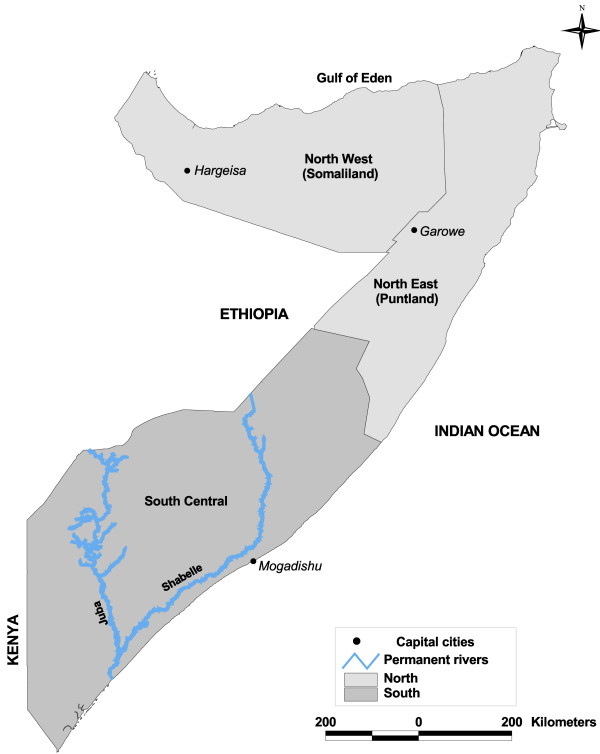
Results: For analyses the country was divided into north and south. In the north, the month of survey, distance to water, precipitation and temperature had no significant association with P. falciparum prevalence when spatial correlation was taken into account. In contrast, all the covariates, except distance to water, were significantly associated with parasite prevalence in the south. The inclusion of covariates improved model fit for the south but not for the north. Model precision was highest in the south. The majority of the country had a predicted prevalence of < 5%; areas with > or = 5% prevalence were predominantly in the south.
Conclusion: The maps showed that malaria transmission in Somalia varied from hypo- to meso-endemic. However, even after including the selected covariates in the model, there still remained a considerable amount of unexplained spatial variation in parasite prevalence, indicating effects of other factors not captured in the study. Nonetheless the maps presented here provide the best contemporary information on malaria prevalence in Somalia.
Figures


References
-
- Snow RW, Marsh K, Le Sueur D. The need for maps of transmission intensity to guide malaria control in Africa. Parasitol Today. 1996;12:455–457. doi: 10.1016/S0169-4758(96)30032-X. - DOI
-
- Lysenko AY, Semashko IN. Geography of malaria: a medico-geographic profile of an ancient disease. In: AW L, editor. Medicinskaja Geografija. Moscow , Academy of Sciences; 1968. p. 146.
Publication types
MeSH terms
Grants and funding
LinkOut - more resources
Full Text Sources
