

Ozagrel reverses streptozotocin-induced constriction of arterioles in rat retina
- PMID: 18718478
- PMCID: PMC2601578
- DOI: 10.1016/j.mvr.2008.07.005
Ozagrel reverses streptozotocin-induced constriction of arterioles in rat retina
Abstract
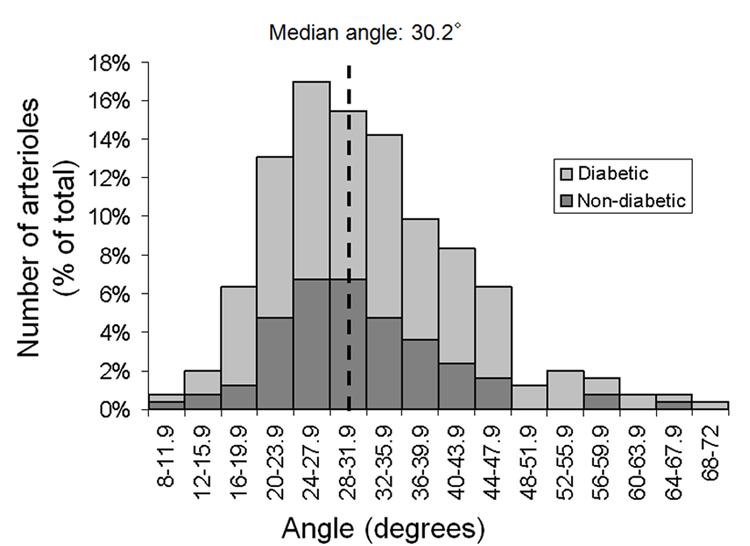
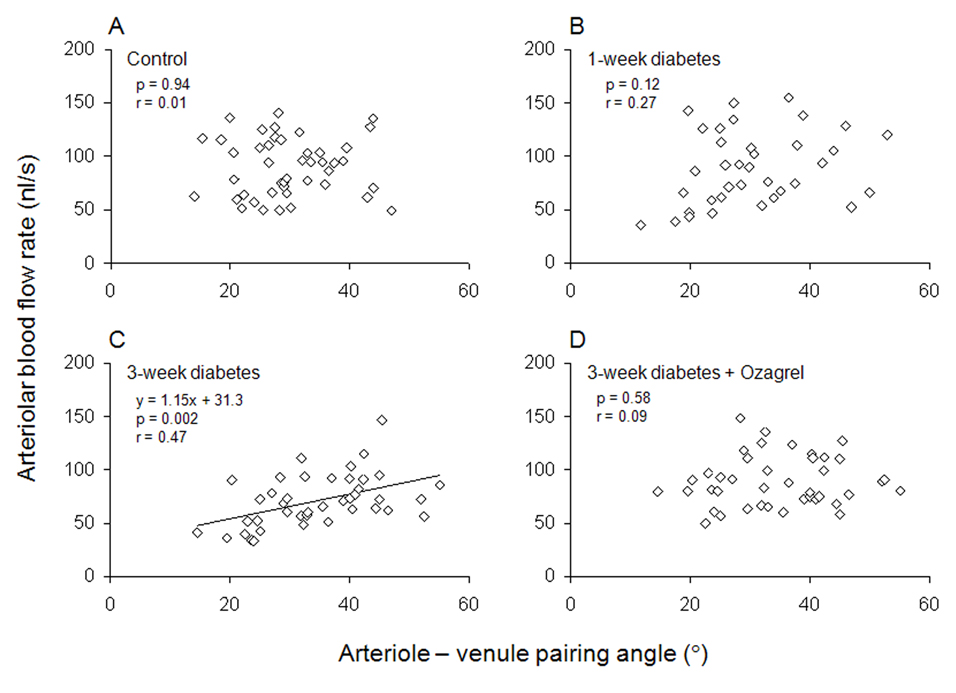
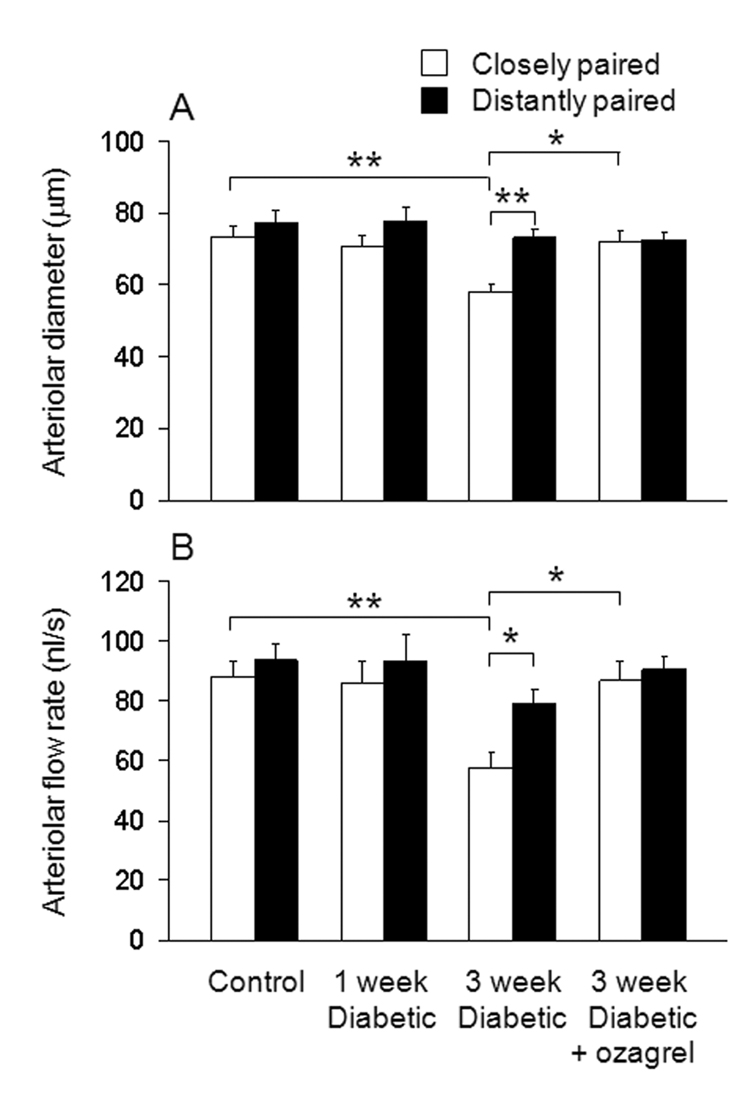
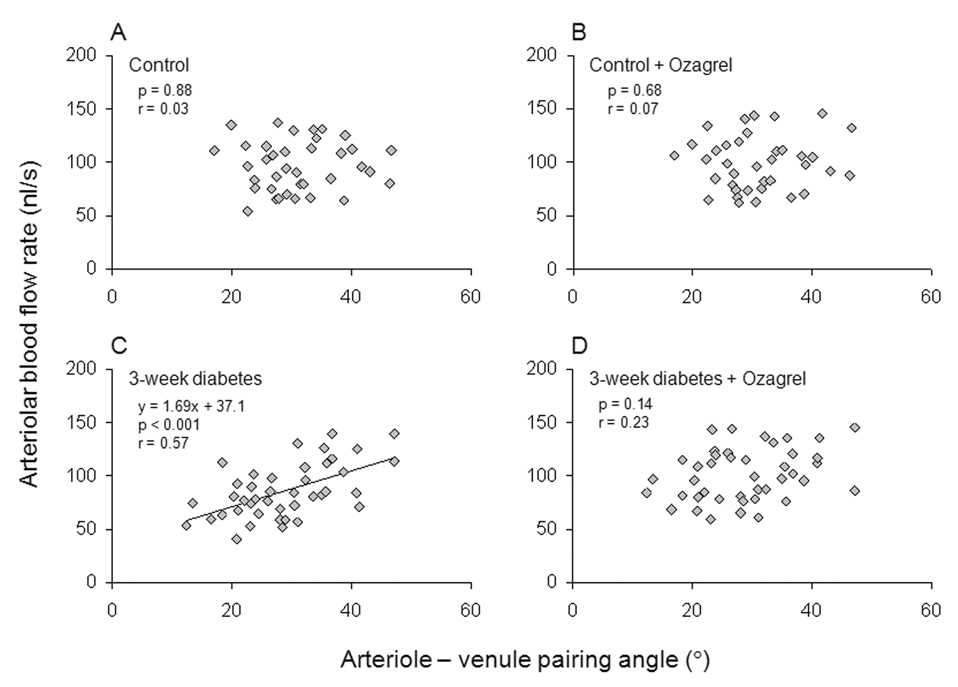
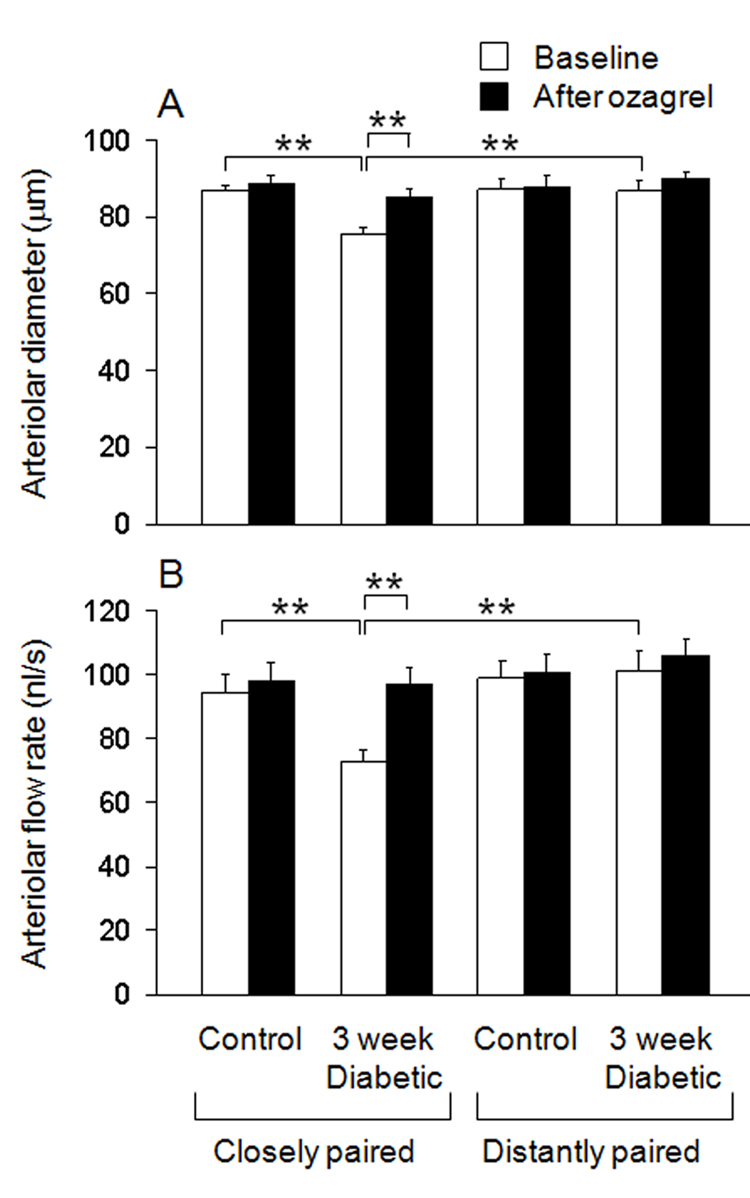
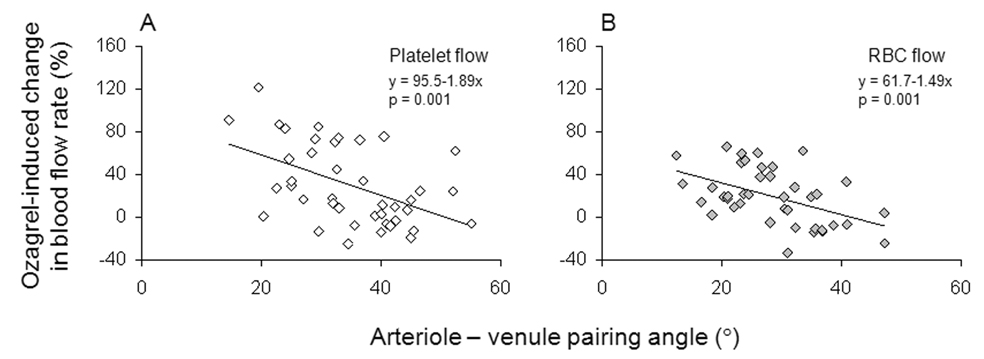
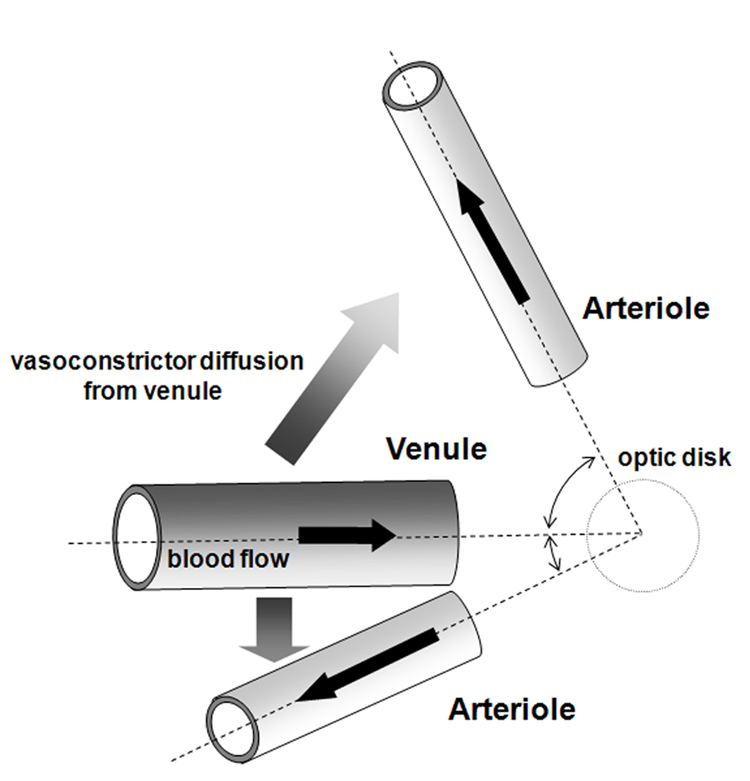
Retinal blood flow decreases early in the progression of diabetic retinopathy; however, the mediators and mechanisms responsible for this decrease have yet to be determined. In this study, diabetes was induced by streptozotocin in rats, and retinal blood flow was measured via intravital microscopy 1 or 3 weeks following the induction of hyperglycemia. Additionally, retinal arteriolar diameters and flow were measured prior to and following acute administration of the thromboxane synthase inhibitor ozagrel to investigate the potential role of thromboxane in the observed constriction. Minimal changes in the retinal diameters and flow were observed at 1 week of diabetes; however, at 3 weeks of diabetes, arteriolar constriction and decreases in blood flow were significant. Notably, the constriction occurred only in the arterioles that were in closer proximity to the venules draining the retina. Acute administration of ozagrel reversed the constriction of the closely venule-paired arterioles. In summary, the results suggest that thromboxane mediates localized, venule-dependent arteriolar constriction induced by streptozotocin-induced diabetes in rats.
Figures

References
-
- Bursell SE, Clermont AC, Kinsley BT, Simonson DC, Aiello LM, Wolpert HA. Retinal blood flow changes in patients with insulin-dependent diabetes mellitus and no diabetic retinopathy. Invest Ophthalmol. Vis. Sci. 1996;37:886–897. - PubMed
-
- Bursell SE, Clermont AC, Shiba T, King GL. Evaluating retinal circulation using video fluorescein angiography in control and diabetic rats. Curr. Eye Res. 1992;11:287–295. - PubMed
-
- Clermont AC, Aiello LP, Mori F, Aiello LM, Bursell SE. Vascular endothelial growth factor and severity of nonproliferative diabetic retinopathy mediate retinal hemodynamics in vivo: a potential role for vascular endothelial growth factor in the progression of nonproliferative diabetic retinopathy. Am. J Ophthalmol. 1997;124:433–446. - PubMed
-
- Clermont AC, Brittis M, Shiba T, McGovern T, King GL, Bursell SE. Normalization of retinal blood flow in diabetic rats with primary intervention using insulin pumps. Invest Ophthalmol. Vis. Sci. 1994;35:981–990. - PubMed
-
- Cringle SJ, Yu DY, Alder VA, Su EN. Retinal blood flow by hydrogen clearance polarography in the streptozotocin-induced diabetic rat. Invest Ophthalmol. Vis. Sci. 1993;34:1716–1721. - PubMed
Publication types
MeSH terms
Substances
Grants and funding
LinkOut - more resources
Full Text Sources
Medical
