

Real-time detection of event-related brain activity
- PMID: 18718544
- PMCID: PMC2603617
- DOI: 10.1016/j.neuroimage.2008.07.037
Real-time detection of event-related brain activity
Abstract
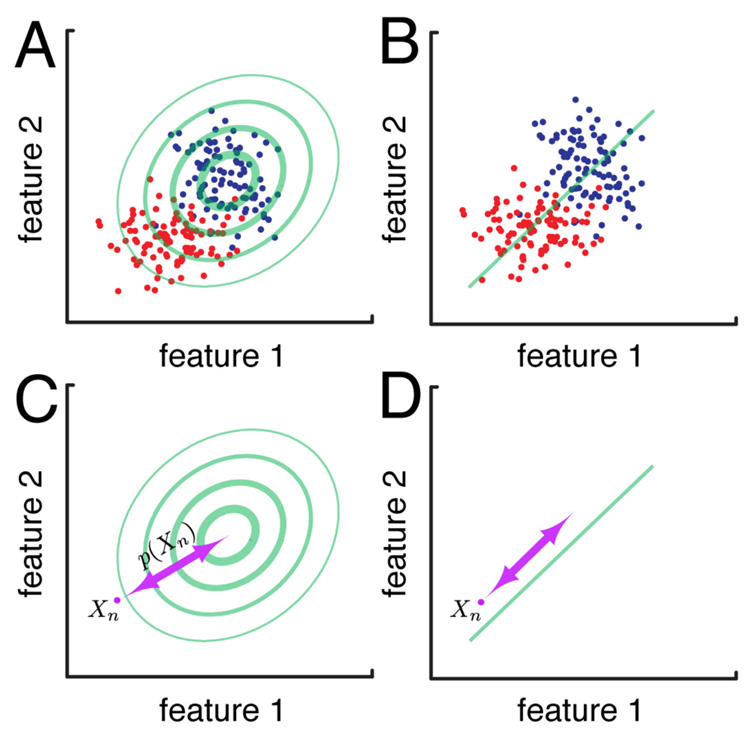
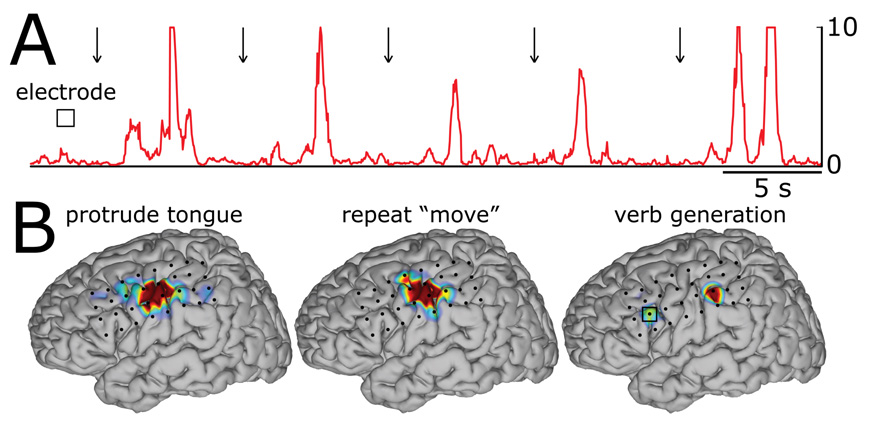
The complexity and inter-individual variation of brain signals impedes real-time detection of events in raw signals. To convert these complex signals into results that can be readily understood, current approaches usually apply statistical methods to data from known conditions after all data have been collected. The capability to provide meaningful visualization of complex brain signals without the requirement to initially collect data from all conditions would provide a new tool, essentially a new imaging technique, that would open up new avenues for the study of brain function. Here we show that a new analysis approach, called SIGFRIED, can overcome this serious limitation of current methods. SIGFRIED can visualize brain signal changes without requiring prior data collection from all conditions. This capacity is particularly well suited to applications in which comprehensive prior data collection is impossible or impractical, such as intraoperative localization of cortical function or detection of epileptic seizures.
Figures


References
-
- Akaike H. Information Theory and an Extension of the Maximum Likelihood Principle. In: Petrov BN, Csaki F, editors. 2nd International Symposium on Information Theory; Budapest. 1973. pp. 267–281.
-
- Celeux G, Govaert G. A Classification EM algorithm for clustering and two stochastic versions. Computational Statistics & Data Analysis. 1992;14:315–332.
-
- Crone NE, Hao L, Hart J, Boatman D, Lesser RP, Irizarry R, Gordon B. 2001 - PubMed
-
- Crone NE, Miglioretti DL, Gordon B, Lesser RP. Functional mapping of human sensorimotor cortex with electrocorticographic spectral analysis. II. Event-related synchronization in the gamma band. Brain. 1998a;121(Pt 12):2301–2315. - PubMed
-
- Crone NE, Miglioretti DL, Gordon B, Sieracki JM, Wilson MT, Uematsu S, Lesser RP. Functional mapping of human sensorimotor cortex with electrocorticographic spectral analysis. I. Alpha and beta event-related desynchronization. Brain. 1998b;121(Pt 12):2271–2299. - PubMed
Publication types
MeSH terms
Grants and funding
LinkOut - more resources
Full Text Sources
Other Literature Sources
Medical
