. 2008 Sep 19;29(3):487-96.
doi: 10.1016/j.immuni.2008.07.012. Epub 2008 Aug 21.

Dynamics of neutrophil migration in lymph nodes during infection

Affiliations

Dynamics of neutrophil migration in lymph nodes during infection

Tatyana Chtanova et al. Immunity. .

Erratum in

  • Immunity. 2008 Oct;29(4):661

Abstract

Although the signals that control neutrophil migration from the blood to sites of infection have been well characterized, little is known about their migration patterns within lymph nodes or the strategies that neutrophils use to find their local sites of action. To address these questions, we used two-photon scanning-laser microscopy to examine neutrophil migration in intact lymph nodes during infection with an intracellular parasite, Toxoplasma gondii. We found that neutrophils formed both small, transient and large, persistent swarms via a coordinated migration pattern. We provided evidence that cooperative action of neutrophils and parasite egress from host cells could trigger swarm formation. Neutrophil swarm formation coincided in space and time with the removal of macrophages that line the subcapsular sinus of the lymph node. Our data provide insights into the cellular mechanisms underlying neutrophil swarming and suggest new roles for neutrophils in shaping immune responses.


Figures
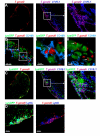
Fig. 1
Fig. 1
Location of T. gondii relative to lymphatics, CD169 macrophages, and neutrophils in draining lymph nodes following earflap infection. (A) 20 um frozen section of a draining lymph node 4 hours after an earflap injection with RFP (red) parasites. Middle panels show staining with LYVE-1 (blue) used to visualize the lymphatic system. Right hand panel shows a high magnification image. (B) RFP parasites (red) are found inside CD169+ subcapsular sinus macrophages (blue) close to LysGFP reporter bright (green) neutrophils. Middle panel (i) shows an enlarged area with parasites inside CD169+ cells. Right panel (ii) shows an enlarged area with intact parasites inside neutrophils. (C) Same samples as in (A) showing signal from the LysGFP reporter (green). (D) Clusters of LysGFP high cells (green) (left panel) stain positive for the neutrophil marker Ly6G (blue). Right panel shows the same image without the LysGFP signal.
Fig. 2
Fig. 2
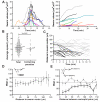
Neutrophil migration and swarm formation in infected lymph nodes. Mice expressing a macrophage/neutrophil transgenic reporter (LysGFP) (Faust et al., 2000) were infected in the ear flap and draining lymph nodes removed at 2 to 5 h post-infection were imaged using TPSLM. (A) Neutrophils form transient (left panel) and persistent (right panel) swarms in intact lymph nodes. The volumes of individual swarms were plotted versus elapsed imaging time. Transient swarms were all <4 × 10⁴ microns3, corresponding to approximately 150 cells based on average volume of a single neutrophil from these runs (275 μm3). (B) Quantitation of neutrophil motility. Each point represents the average speed for an individual track of a neutrophil outside of a swarm. The tracks of neutrophils containing signal from red fluorescent parasites were plotted on the right. (C) Distance to swarm center versus time. Each line represents an individual track. Solid black lines correspond to neutrophils that eventually enter a swarm. Grey lines correspond to tracks of neutrophils that do not enter the swarm. (D) Plot of the mean “directionality angle” or psi for a run in which swarms formed. Psi is defined as the angle between the migration vector and the direction vector from the initial position of the migrating cell to the center of the swarm (see inset). Psi values were binned based on the distance of the cell to the swarm center, and the mean values are plotted versus the distance to swarm center. Dashed line indicates the value expected for random migration (90 degrees). Values less than 90 degrees indicate directed migration toward the swarm center. Values were expressed as mean ± standard error. The confidence interval over all distances is 73-77 degrees, and the p value for the probability that the mean distribution is 90 degrees is 10-40. (E) Coordinated migration during swarm formation. The “coordination angle” alpha is defined as the angle between the migration vectors for pairs of time points within 2 individual tracks (see inset). Alpha values were binned based on the distance between cell pairs and plotted versus the distance between pairs. Solid black line represents the values for a run with a swarm (Corresponds to Suppl Video 1). Grey line represents the values for a run with no obvious swarms. Values were expressed as mean ± standard error. The confidence interval for the run with a swarm over all distances is 77-83 degrees, and the p value for the probability that the mean distribution is 90 degrees is 10-5. The confidence interval for the run without a swarm over all distances is 88-93 degrees, and the p value for the probability that the mean distribution is 90 degrees is 0.3. (Corresponds to Suppl Video 5).
Fig. 3
Fig. 3
Neutrophil swarm formation can occur in 2 temporal stages. Corresponds to Suppl Video 8. Two-phase swarm formation was observed in ∼40% (9/22) initiation events examined. Additional examples are in Suppl Videos 6, 7, 9. (A) Left panel shows a time point during stage 1 with the tracks of early arriving neutrophils depicted as white lines. Right panel shows a time point during stage 2 with the tracks of late-arriving neutrophils depicted as white lines. (B) Distance to swarm center versus time for the tracks of neutrophils that enter the swarm. The tracks in red correspond to early arriving neutrophils (stage 1), and the tracks in black correspond to late arriving neutrophils (stage 2). Note that tracks end when neutrophils arrive at the edge of the swarm, due to difficulty in identifying individual cells once they enter the swarm.
Fig. 4
Fig. 4
Parasite egress coincides with neutrophil clustering. Parasite egress is indicated by close apposition of non-motile parasites followed by the sudden acquisition of parasite motility. Corresponds to Suppl Video 10. Neutrophil clustering was associated with four out of the five instances of parasite egress observed. Additional examples are shown in Suppl Videos 9 and 11. (A) Neutrophils (lysGFP reporter) are in green and T. gondii (RFP) are in red. The tracks of neutrophils that enter cluster are indicated as yellow lines. Left panel shows a time point before parasite egress. The non-motile group of parasites is indicated by a dashed white circle. Middle panel show the time point when parasite motility is first detected. Newly motile parasites are indicated by arrowheads. Right panel show a time point after egress. (B) Distance from neutrophil to site of parasite egress versus time. Black lines correspond to the tracks of individual cells that migrate toward the site of parasite egress. Shaded lines indicate tracks that do not join the cluster.
Fig. 5
Fig. 5
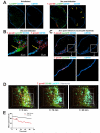
Neutrophil clearing of CD169+ macrophages. (A) Low magnification confocal images of a whole lymph node of LysGFP reporter (green) stained with CD169 antibody (blue). The left panels show an uninfected lymph node while the right panels show a draining lymph node 3 hours after infection with RFP parasites (red). Right hand panels show CD169 staining only. Yellow arrows indicate location of gaps in the CD169 staining. (B) Higher magnification confocal image of a lymph node section showing a neutrophil cluster (green) in an area free of parasites (red) and CD169 staining (blue). Right panel shows CD169 and parasite signal only. The position of swarm is indicated by yellow arrows. (C) Confocal image of a draining lymph node from a mouse that was depleted of neutrophils just prior to infection, and analyzed 3 hours after infection with RFP parasites. The lower panels show an enlarged view of the boxed area indicating an area of high infection within a continuous CD169 layer. Right panel shows CD169 staining only. (D) Two-photon images of a lymph node showing CD169 staining (green), neutrophils (cyan), parasites (red) and lymph node capsule (2nd harmonic signal: grey). Left panel shows a time point just before a swarm forms. Center panel shows a time point during swarming. Cleared area is indicated by a white rectangle. Right panel shows a time point just after the swarm breaks up. Corresponds to Suppl Video 12. (E) Progressive disappearance of CD169 signal in local region of lymph node sinus. Fluorescence intensity of CD169 label in an area where clearing was observed by twophoton imaging and plotted against time (red line). The change in fluorescence intensity for the whole imaging volume is shown as a control for fluorophore bleaching (black line). Arrow indicates the approximate time when CD169 clearing was first observed. Corresponds to Suppl Video 13.
Fig. 6
Fig. 6
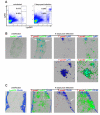
Neutrophil recruitment and swarm formation in mesenteric lymph nodes after oral infection. (A) Neutrophils (LysGFPhigh Ly6G+) in the mesenteric lymph nodes of orally infected mice. Flow cytometry analysis of mesenteric lymph nodes of uninfected LysGFP mice, or LysGFP reporter mice infected 5 days earlier with 20 cysts. (B) 20 um frozen sections of mesenteric lymph nodes of LysGFP reporter (green) mice before infection (left panel) or 4 days after oral infection with 45 cysts of Pruniaud-RFP (red) stained with Ly6G (blue). Arrows indicate neutrophil cluster at the subcapsulary sinus. Bottom panels show a high magnification image of a lymph node from an infected mouse. Clusters of LysGFP high cells (green) (left panel) stain positive for the neutrophil marker Ly6G (blue). (C) Same samples as in (B) were stained to visualize CD169+ subcapsular sinus macrophages (blue). Right panels show a high magnification image with an arrow indicating a region of CD169 clearing.

References

    1. Abadie V, Badell E, Douillard P, Ensergueix D, Leenen PJ, Tanguy M, Fiette L, Saeland S, Gicquel B, Winter N. Neutrophils rapidly migrate via lymphatics after Mycobacterium bovis BCG intradermal vaccination and shuttle live bacilli to the draining lymph nodes. Blood. 2005;106:1843–1850. - PubMed
    1. Adachi O, Kawai T, Takeda K, Matsumoto M, Tsutsui H, Sakagami M, Nakanishi K, Akira S. Targeted disruption of the MyD88 gene results in loss of IL-1- and IL-18-mediated function. Immunity. 1998;9:143–150. - PubMed
    1. Appelberg R. Neutrophils and intracellular pathogens: beyond phagocytosis and killing. Trends in microbiology. 2007;15:87–92. - PubMed
    1. Baggiolini M. Chemokines and leukocyte traffic. Nature. 1998;392:565–568. - PubMed
    1. Beauvillain C, Delneste Y, Scotet M, Peres A, Gascan H, Guermonprez P, Barnaba V, Jeannin P. Neutrophils efficiently cross-prime naive T cells in vivo. Blood. 2007;110:2965–2973. - PubMed

Publication types