. 2008 Oct 17;283(42):28106-14.
doi: 10.1074/jbc.M803508200. Epub 2008 Aug 21.

Induction of pyruvate dehydrogenase kinase-3 by hypoxia-inducible factor-1 promotes metabolic switch and drug resistance

Affiliations

Induction of pyruvate dehydrogenase kinase-3 by hypoxia-inducible factor-1 promotes metabolic switch and drug resistance

Chun-Wun Lu et al. J Biol Chem. .

Abstract

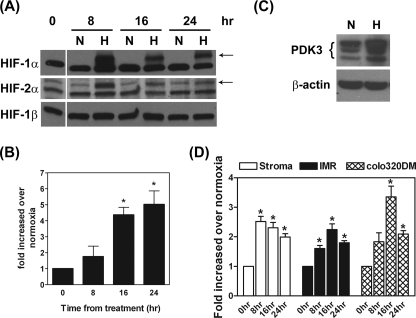
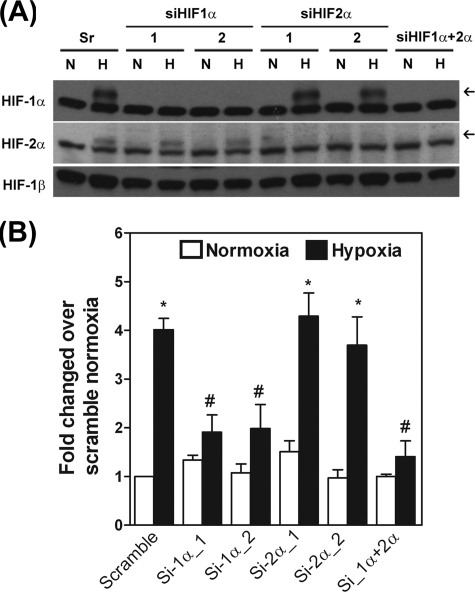
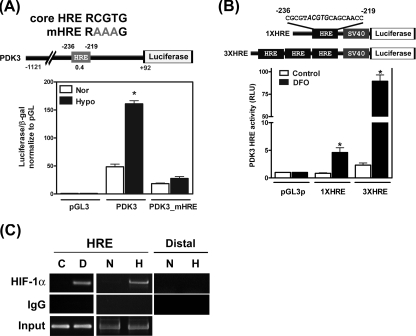
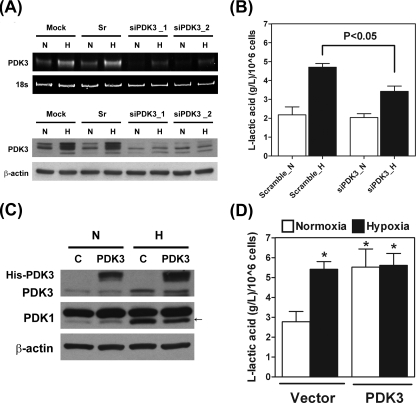
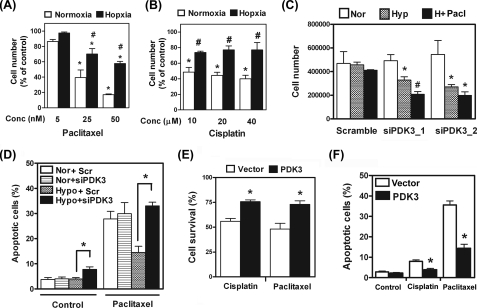
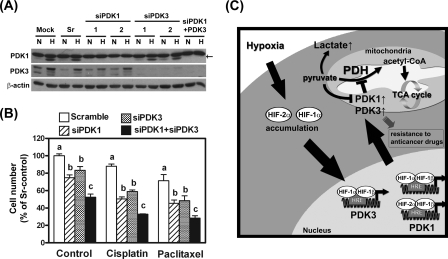
The switch of cellular metabolism from mitochondrial respiration to glycolysis is the hallmark of cancer cells and associated with tumor malignancy. However, the mechanism of this metabolic switch remains largely unknown. Herein, we reported that hypoxia-inducible factor-1 (HIF-1) induced pyruvate dehydrogenase kinase-3 (PDK3) expression leading to inhibition of mitochondrial respiration. Promoter activity assay, small interference RNA knockdown assay, and chromatin immunoprecipitation assay demonstrated that hypoxia-induced PDK3 gene activity was regulated by HIF-1 at the transcriptional level. Forced expression of PDK3 in cancer cells resulted in increased lactic acid accumulation and drugs resistance, whereas knocking down PDK3 inhibited hypoxia-induced cytoplasmic glycolysis and cell survival. These data demonstrated that increased PDK3 expression due to elevated HIF-1alpha in cancer cells may play critical roles in metabolic switch during cancer progression and chemoresistance in cancer therapy.


Figures

FIGURE 1.
FIGURE 1.
Hypoxia induces PDK3 expression in normal and cancer cells. A, HeLa cells were cultured under normoxia (N) or hypoxia (H) conditions for 8, 16, and 24 h. Cells were lysed in radioimmune precipitation assay buffer, and expression of HIF-1α, HIF-2α, and HIF-1β was detected via Western blot using specific antibodies. Arrows indicate specific hypoxia-induced HIF-1α and HIF-2α proteins, respectively. The lower bands are nonspecific signals. B, HeLa cells were cultured under normoxia or hypoxia conditions for 8, 16, or 24 h, and expression of PDK3 mRNA was quantified by real-time RT-PCR (n = 6). Asterisks indicate significant differences from the 0-h control. C, representative image shows the expression of PDK3 protein in HeLa cells under normoxia (N) and hypoxia (H) conditions for 24 h. This experiment was repeated for four times and the result was similar. D, human endometrial stromal cells (primary culture, n = 6 using different batches of cells), IMR32 cells (n = 3), and colo320DM cells (n = 3) were cultured under normoxia or hypoxia conditions for 8, 16, and 24 h, and expression of PDK3 mRNA was quantified by real-time RT-PCR. Asterisks indicate significant differences compared with the 0-h control.
FIGURE 2.
FIGURE 2.
Up-regulation of PDK3 is mediated by HIF-1α. A, HeLa cells were transfected with siRNAs against HIF-1α, HIF-2α, HIF-1α plus HIF-2α, or GC content-matched scramble control. After transfection for 6 h, cells were cultured under normoxia or hypoxia conditions for 24 h, and levels of HIF-1α, HIF-2α, and HIF-1β were detected by Western blot using specific antibodies. The experiment was repeated three times with similar results. B, HeLa cells were transfected with siRNAs against HIF-1α, HIF-2α, HIF-1α plus HIF-2α, or GC content-matched scramble siRNA. After transfection for 6 h, cells were cultured under normoxia or hypoxia conditions for 24 h, and expression of mRNA for PDK3 was quantified by real-time RT-PCR (n = 3). Asterisks indicate significant differences from normoxia group. #, indicates significant difference from the hypoxia-treated scramble group.
FIGURE 3.
FIGURE 3.
Induction of PDK3 by HIF-1α is controlled at the transcriptional level. A, HeLa cells were transiently transfected with control plasmid (pGL3), PDK3, or core HRE mutated PDK3 (PDK3-mHRE) reporter constructs and then cultured under normoxia (21% O2) or hypoxia (1% O2) for 24 h. The reporter plasmid containing β-galactosidase (β-gal) was co-transfected for internal control. Data show mean ± S.E. (S.E.) of four independent experiments performed in duplicate. Asterisks indicate significant differences between hypoxia and normoxia groups by unpaired t test. The promoter construct of PDK3 with predicted HRE (gray boxes), score of HRE (numbers under HRE boxes), and the sequences of core HRE and mutated core HRE (mHRE) are shown on top of the figure. B, HeLa cells were co-transfected with β-galactosidase and SV40-driven pGL3 reporter plasmids containing no (pGL3p), one copy (1XHRE), or three copies (3XHRE) of predicted PDK3 HRE sequences and subjected to vehicle (control) or DFO treatment for 24 h. Promoter activities were determined by measuring luciferase and β-galactosidase activities. Data show mean ± S.E. from three independent experiments. Asterisks indicate significant differences between DFO and control groups. C, HeLa cells were cultured under normoxia (N) or hypoxia (H) condition or treated with DFO (D) for 12 h, and binding of HIF-1α to the PDK3 HRE was detected by chromatin immunoprecipitation-PCR assay. Normal rabbit IgG was used as negative control. Un-precipitated genomic DNA (2%) was used for input control. A second set of primer that locates 3.5 kb upstream of predicted HRE site (designed as distal) was also used to amplify the HIF-1α antibody pulled down DNA as control. The experiment was repeated three times with similar results.
FIGURE 4.
FIGURE 4.
Up-regulation of PDK3 expression results in increased lactic acid production. A, HeLa cells were transfected with siRNA against PDK3 (siPDK3_1 and siPDK3_2), GC content matched scramble control (Sr), or transfection reagent only (Mock) and cultured under normoxia or hypoxia condition for another 24 h. Levels of PDK3 mRNA and protein were determined by RT-PCR and Western blot, respectively. These experiments were repeated three times with similar results. B, HeLa cells were transfected with siRNA against PDK3 (siPDK3_1 was used) or GC content-matched scramble control (Sr) and cultured for 24 h. Production of lactic acid was determined by using an EIA kit. Data show mean ± S.E. of three independent experiments. C, HeLa cells were transiently transfected with empty vector (C) or histidine-tagged full-length human PDK3 cDNA and cultured under normoxia (N) or hypoxia (H) condition for 24 h. Expression of endogenous and his-tagged PDK3 protein was detected by Western blot. D, HeLa cells were transiently transfected with empty vector (Vector) or full-length human PDK3 cDNA (PDK3) and cultured under normoxia or hypoxia condition for 24 h. Production of lactic acid was measured by using an EIA kit. Data show mean ± S.E. of four independent experiments. Asterisks indicate significant difference from the normoxia-vector group.
FIGURE 5.
FIGURE 5.
Up-regulation of PDK3 by hypoxia increases drug resistance. A, HeLa cells were treated with different doses of paclitaxel and cultured under normoxia or hypoxia conditions for 24 h. Numbers of live cells were counted and expressed as percentage of control. Data show mean ± S.E. of four independent experiments. Asterisks indicate significant differences from untreated group. #, indicates significant difference between normoxia and hypoxia groups. B, HeLa cells were treated with different doses of cisplatin and cultured under normoxia or hypoxia condition for 24 h. Numbers of live cells were counted and expressed as percentage of control. Data show mean ± S.E. of four independent experiments. Asterisks indicate significant differences from untreated group. #, indicates significant difference between normoxia and hypoxia groups. C, HeLa cells were transfected with siRNA against PDK3 (siPDK3_1 and siPDK3_2) or GC content-matched scramble siRNA and cultured under normoxia (Nor), hypoxia (Hyp), or hypoxia plus 25 nm paclitaxel (H + Pacl) for 24 h. Cells were then washed three times with phosphate-buffered saline, and attached live cells were counted under a microscope in the presence of trypan blue dye. Data show mean ± S.E. of four independent experiments. Asterisks indicate significant difference from normoxia groups; #, indicates different from both normoxia and hypoxia groups. D, HeLa cells were transfected with siRNA against PDK3 (siPDK_1) or GC content-matched scramble siRNA and cultured under normoxia or hypoxia and treated with or without 25 nm paclitaxel for 24 h. Apoptotic cells were analyzed by TUNEL assay as described under “Experimental Procedures.” Data show mean ± S.E. of three independent experiments using different batches of cells. E, HeLa cells were transiently transfected with empty vector (Vector) or full-length human PDK3 cDNA (PDK3) and cultured under normoxia condition with vehicle, or cisplatin (20 μm), or paclitaxel (25 nm) for 24 h. Numbers of live cells were counted and expressed as percentage of control (without drug treatment). Data show mean ± S.E. of three independent experiments. Asterisk indicates significant difference between PDK3-overexpressed and vector-only groups. F, HeLa cells were treated as described in E except that TUNEL assay was used to determine the number of apoptotic cells. Asterisk indicates significant difference between PDK3-overexpressed and vector-only groups.
FIGURE 6.
FIGURE 6.
The additive effect of PDK1 and PDK3 in HIF-induced drug resistance. A, HeLa cells were transiently transfected with siRNAs against PDK1 (si1–1 and si1–2), PDK3 (si3–1 and si3–2), both PDK1 and PDK3 (si1 + 3), or scramble control and subjected to normoxia or hypoxia treatment for 24 h. Expression of PDK1, PDK3, and β-actin was detected by Western blot. The arrow indicates specific PDK1 signal. B, HeLa cells were transiently transfected with siRNAs as indicated and subjected to vehicle (control), cisplatin (20 μm), or paclitaxel (25 nm) treatment under hypoxia condition for 24 h. Numbers of live cells were counted and expressed as percentage of scramble-control (sr-control). Data show mean ± S.E. of three independent experiments. Different letters indicate significant difference among the siRNA-transfected groups within each drug treatment group. C, schematic drawing summarizes effect of hypoxia or HIF in PDK1 and PDK3 expression and the downstream effects on metabolic switch and drug resistance.

Similar articles

Cited by

References

    1. Warburg, O., Wind, F., and Neglers, E. (1930) The Metabolism of Tumors Constable and Co., London, pp. 254–270
    1. Iyer, N. V., Kotch, L. E., Agani, F., Leung, S. W., Laughner, E., Wenger, R. H., Gassmann, M., Gearhart, J. D., Lawler, A. M., Yu, A. Y., and Semenza, G. L. (1998) Genes Dev. 12 149–162 - PMC - PubMed
    1. Seagroves, T. N., Ryan, H. E., Lu, H., Wouters, B. G., Knapp, M., Thibault, P., Laderoute, K., and Johnson, R. S. (2001) Mol. Cell. Biol. 21 3436–3444 - PMC - PubMed
    1. Greijer, A. E., van der Groep, P., Kemming, D., Shvarts, A., Semenza, G. L., Meijer, G. A., van de Wiel, M. A., Belien, J. A., van Diest, P. J., and van der Wall, E. (2005) J. Pathol. 206 291–304 - PubMed
    1. Patel, M. S., and Korotchkina, L. G. (2001) Exp. Mol. Med. 33 191–197 - PubMed

Publication types

Substances