. 2008 Nov 21;283(47):32462-70.
doi: 10.1074/jbc.M801813200. Epub 2008 Aug 21.

In vivo and in vitro studies of a functional peroxisome proliferator-activated receptor gamma response element in the mouse pdx-1 promoter

Affiliations

In vivo and in vitro studies of a functional peroxisome proliferator-activated receptor gamma response element in the mouse pdx-1 promoter

Dhananjay Gupta et al. J Biol Chem. .

Abstract

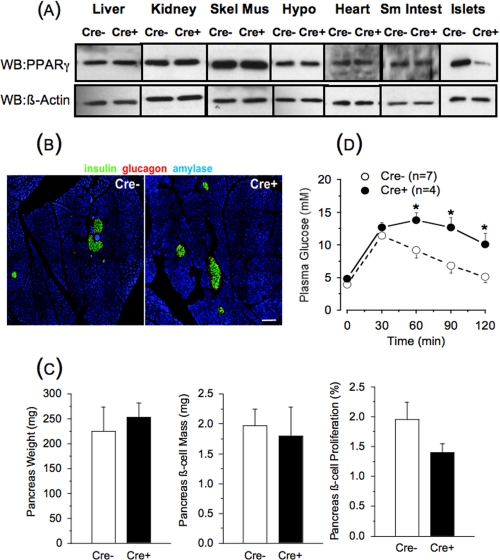
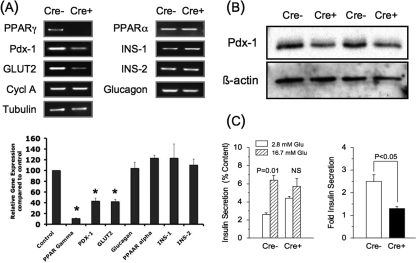
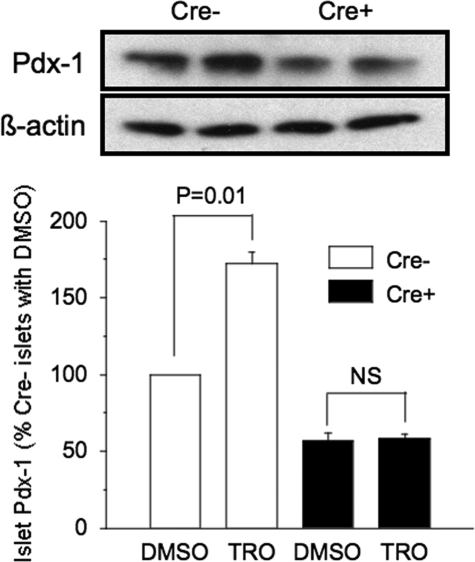
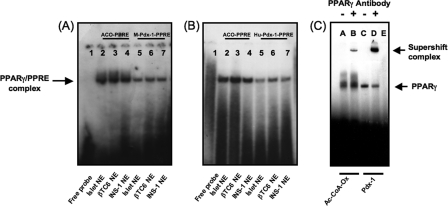
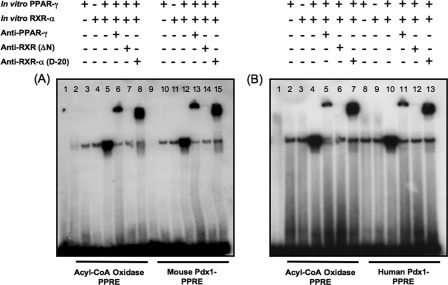
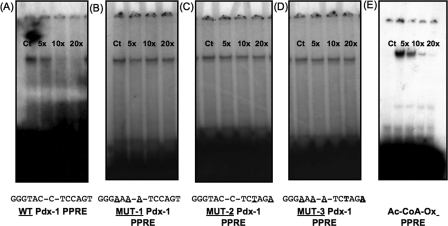
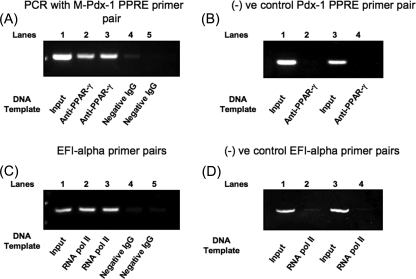
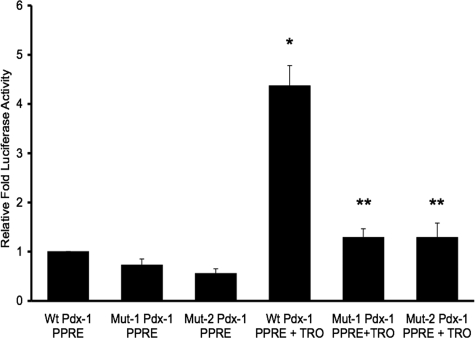
We reported that peroxisome proliferator-activated receptor gamma (PPARgamma) transcriptionally regulates the beta-cell differentiation factor pancreatic duodenal homeobox (PDX)-1 based on in vitro RNA interference studies. We have now studied mice depleted of PPARgamma within the pancreas (PANC PPARgamma(-/-)) created by a Cre/loxP recombinase system, with Cre driven by the pdx-1 promoter. Male PANC PPARgamma(-/-) mice were hyperglycemic at 8 weeks of age (8.1+/-0.2 mM versus 6.4+/-0.3 mM, p=0.009) with islet cytoarchitecture and pancreatic mass of islet beta-cells that were indistinguishable from the controls. Islet PDX-1 mRNA (p=0.001) and protein levels (p=0.003) were lowered 60 and 40%, respectively, in tandem with impaired glucose-induced insulin secretion and loss of thiazolidinedione-induced increase in PDX-1 expression. We next identified a putative PPAR-response element (PPRE) in the mouse pdx-1 promoter with substantial homology to the corresponding region of the human PDX-1 promoter. Electrophoretic mobility supershift assays with nuclear extracts from beta-cell lines and mouse islets, also in vitro translated PPARgamma and retinoid X receptor, and chromatin immunoprecipitation analysis demonstrated specific binding of PPARgamma and retinoid X receptor to the human and mouse pdx-1 x PPREs. Transient transfection assays of beta-cells with reporter constructs of mutated PPREs showed dramatically reduced pdx-1 promoter activity. In summary, we have presented in vivo and in vitro evidence showing PPARgamma regulation of pdx-1 transcription in beta-cells, plus our results support an important regulatory role for PPARgamma in beta-cell physiology and thiazolidinedione pharmacology of type 2 diabetes.


Figures

FIGURE 1.
FIGURE 1.
Tissue panel for PPARγ immunoblot (A), pancreas histology (B), pancreas morphometrics (C), and intraperitoneal glucose tolerance test results (D) in 8-week-old male floxed control (Cre-) and PANC PPARγ-/- mice (Cre+). A, representative PPARγ immunoblot of liver, kidney, skeletal muscle (Skel Mus), hypothalamus (Hypo), heart, small intestine (Sm Intest), and isolated islets. Membranes were stripped and reprobed to establish equivalent loading using anti-β-actin antibody. WB, Western blot. B, representative immunofluorescence staining for insulin, glucagon, and amylase in pancreatic sections of control and PANC PPARγ-/- mice. Scale bars, 50 μm. C, comparison of pancreas weights, pancreas β-cell mass, and β-cell proliferation rates of control and PANC PPARγ-/- mice. None of the parameters statistically differed between the animal groups. D, blood glucose values after intraperitoneal injection of glucose (2 g/kg body weight) in control and PANC PPARγ-/- mice. *, p < 0.05.
FIGURE 2.
FIGURE 2.
Quantitative PCR analysis (A), PDX-1 immunoblot (B), and glucose-stimulated insulin secretion (C), in isolated islets from 8-week-old male floxed control (Cre-) and PANC PPARγ-/- mice (Cre+). A, quantitative PCR analysis of various genes from total RNA preparations of isolated islets. α-Tubulin and cyclophilin A (Cycl A) were used as internal controls. A representative gel is shown, and the graph contains the mean ± S.E. band intensities from the three separate experiments, with the Cre+ islets expressed as % intensity compared with the Cre- islets. *, p < 0.05. B, representative immunoblot for PDX-1 and β-actin from islet lysates of two control and two PANC PPARγ-/- mice. C, insulin secretion from freshly isolated Cre- (n = 4) and Cre+ (n = 3) islets stimulated for 1 h with 2.8 or 16.7 mm glucose expressed as percentage of total insulin content. Also shown is the fold increase of the insulin response at 16.7 mm glucose versus 2.8 mm glucose.
FIGURE 3.
FIGURE 3.
PDX-1 immunoblot post 72 h of incubation with troglitazone or the diluent DMSO in isolated islets from 8-week-old male floxed control (Cre-) and PANC PPARγ-/- mice (Cre+). Isolated islets were cultured 72 h in medium with 10 μm troglitazone (Tro) or vehicle (DMSO) and then islet lysates underwent PDX-1 immunoblotting. Membranes were stripped and reprobed with β-actin antibody. A representative gel is shown, and the graph contains the mean ± S.E. band intensities from the three separate experiments expressed as % intensity of each experimental condition compared with Cre- islets incubated with DMSO. NS = not significant.
FIGURE 4.
FIGURE 4.
Nuclear extract binding to the putative PPRE sequences in the mouse (A) and human pdx-1 promoters (B) along with the PPRE in acyl-CoA oxidase as control, and supershift of the DNA·protein complexes of the acyl-CoA oxidase and mouse pdx-1 × PPREs using PPARγ-specific antibody (C) are shown. 32P-Labeled double-stranded probes for the PPRE in acyl-CoA oxidase and the purported mouse and human pdx-1 × PPREs, underwent DNA binding reaction using nuclear extracts from mouse islets, mouse-derived βTC6 cells, or rat-derived INS-1 cells. A and B, lane 1, free probe; lanes 2–4, nuclear extracts of mouse islets, βTC6 cells, and INS-1 cells with acyl-CoA oxidase PPRE; lanes 5–7, nuclear extracts of mouse islets, βTC6 cells, and INS-1 cells with pdx-1 × PPRE. NE = nuclear extract; ACO = acyl-CoA oxidase. C, INS-1 cell nuclear extract was preincubated with PPARγ-specific antibody or rabbit nonimmune serum on ice for 30 min before adding 32P-labeled acyl-CoA oxidase or mouse pdx-1 × PPRE oligo probes and resolution of the DNA·protein complexes by PAGE. Lanes A and B, acyl-CoA oxidase PPRE with nonimmune serum or PPARγ-specific antibody, respectively; lanes C and D, pdx-1 × PPRE with nonimmune serum or PPARγ-specific antibody, respectively; lane E, free probe.
FIGURE 5.
FIGURE 5.
In vitro translated PPARγ and RXR-α are binding partners for acyl-CoA oxidase, mouse pdx-1, and human pdx-1 × PPRE probes. In vitro translated RXR-α and PPARγ proteins were used in the DNA binding reaction in place of nuclear extracts (alone or in combination) along with 32P-labeled oligo PPRE probes for acyl-CoA oxidase and mouse pdx-1 (A) or human PDX-1 (B). For the supershift assays, binding reactions were preincubated with antibodies for PPARγ, RXR, or RXR-α. A, lanes 2–8, acyl-CoA oxidase PPRE probe; lanes 9–15 mouse pdx-1 × PPRE probe. Lane 1, free probe; lanes 2 and 9, INS-1 nuclear extract; lanes 3 and 10: in vitro translated PPARγ; lanes 4 and 11, in vitro translated RXR-α; lanes 5 and 12, in vitro translated RXR-α and PPARγ together; lanes 6 and 13, in vitro translated RXR-α and PPARγ together showing supershifted complex with PPARγ-specific antibody; lanes 7 and 14, in vitro translated RXR-α and PPARγ showing a lowered band intensity from prevention of the complex formation with the PAN RXR antibody; lanes 8 and 15, in vitro translated RXR-α and PPARγ together showing supershifted complex with RXR-α-specific antibody. B, lanes 2–7, acyl-CoA oxidase PPRE probe; lanes 8–13, human pdx-1 ×PPRE probe. Lane 1, free probe; lanes 2 and 8, in vitro translated PPARγ; lanes 3 and 9, in vitro translated RXR-α; lanes 4 and 10, in vitro translated RXR-α and PPARγ together; lanes 5 and 11, in vitro translated RXR-α and PPARγ together showing supershifted complex with PPARγ-specific antibody; lanes 6 and 12, in vitro translated RXR-α and PPARγ showing a lowered band intensity from prevention of the complex formation with the PAN RXR antibody; lanes 7 and 13, in vitro translated RXR-α and PPARγ together showing supershifted complex with RXR-α-specific antibody.
FIGURE 6.
FIGURE 6.
Mutated mouse pdx-1 × PPRE fails to compete with 32P-labeled pdx-1 × PPRE probes. Double-stranded pdx-1 × PPRE oligos were labeled by end filling with [32P], and DNA binding reaction performed using INS-1 cell nuclear extracts as described under “Experimental Procedures.” Competition was assessed by adding 5–20× molar excess of unlabeled wild type or mutated pdx-1 × PPRE oligos (A–D). Mutated sequences are shown at the bottom of each panel. Alternatively, competition was assessed with 5–20× molar excess of unlabeled wild type acyl-CoA oxidase PPRE oligo added to the binding reaction (E). A, wild type unlabeled pdx-1 × PPRE oligo. B, mutated 5′-half-site (DR1) unlabeled pdx-1 × PPRE oligo (MUT 1). C, mutated 3′-half-site (DR2) unlabeled pdx-1 × PPRE oligo (MUT 2). D, combined mutated DR1 and DR2 unlabeled pdx-1 × PPRE oligo (MUT 3). E, wild type unlabeled acyl-CoA oxidase PPRE probe. Ct = control.
FIGURE 7.
FIGURE 7.
Chromatin immunoprecipitation assay of BTC6 cells. 500–600-bp chromatin preparations of BTC6 cells were prepared as described under “Experimental Procedures.” A, they were immunoprecipitated using mouse monoclonal PPARγ and negative control IgG, followed by PCR of the immunoprecipitated and nonimmunoprecipitated DNA (input DNA) using flanking primer pairs to mouse pdx-1 × PPRE. The shown bands are 312-bp (expected length) PCR product from two separate experiments, along with absence of PCR product in the control IgG lanes on the right. B, negative control was performed using primer pairs for a 450-bp area 2.7 kilobases downstream of the mouse pdx-1 × PPRE. The expected length band was obtained with input DNA but not the PPARγ-immunoprecipitated DNA. C, as a positive control, in parallel chromatin preparations were precipitated with RNA pol II antibody and underwent PCR of the immunoprecipitated and input DNA using EFI primer pairs. The shown bands are 250-bp (expected length) PCR product from two separate experiments in the RNA pol II antibody and input DNA lanes compared with the expected absence of a PCR product in the control IgG lanes. D, negative control for the RNA pol II immunoprecipitated and input DNA using the negative control primer pairs for RNA pol II.
FIGURE 8.
FIGURE 8.
Luciferase reporter activity of wild type and mutated mouse pdx-1 × PPRE transfected into INS-1 cells. INS-1 cells were transfected with wild type (Wt) or mutated pTAL × PPRE × pdx-1 promoter vectors (Mut-1 or Mut-2). Renilla luciferase reporter plasmid was included in all transfections to act as internal control. 24 h post-transfection, cells were treated with 10 μm troglitazone (TRO) or DMSO for 24 h. Firefly luciferase activity was measured by luminometer, normalized with Renilla luciferase, and expressed as relative luciferase activity. Mut 1 contains the mutation of the 5′ DR1 half-site of pdx-1 × PPRE from Fig. 5B. Mut 2 contains the mutation of the 3′ DR2 half-site of pdx-1 × PPRE from Fig. 5C. There were three wells for each experimental condition per experiment. Data are expressed as the mean ± S.E. relative luciferase activity of three separate experiments compared with the wild type pdx-1 × PPRE without troglitazone in lane 1.*, p < 0.001 wild type plus TRO versus wild type plus DMSO. **, p < 0.001 wild type plus troglitazone versus Mut-1 or Mut-2 plus troglitazone.

References

    1. Francis, G. A., Fayard, E., Picard, F., and Auwerx, J. (2003) Annu. Rev. Physiol. 65 261-311 - PubMed
    1. Rosen, E. D., and Spiegelman, B. M. (2001) J. Biol. Chem. 276 37731-37734 - PubMed
    1. Picard, F., and Auwerx, J. (2002) Annu. Rev. Nutr. 22 167-197 - PubMed
    1. Lehrke, M., and Lazar, M. A. (2005) Cell 123 992-999 - PubMed
    1. Kliewer, S. A., Umesono, K., Noonan, D. J., Heyman, R. A., and Evans, R. M. (1992) Nature 358 771-774 - PMC - PubMed

Publication types