

Multifocal ERG responses in infants
- PMID: 18719077
- PMCID: PMC2615068
- DOI: 10.1167/iovs.08-2429
Multifocal ERG responses in infants
Abstract
Purpose: To assess function of the central retina in 10-week-old infants, multifocal electroretinograms (mfERGs) were recorded. mfERG responses represent postreceptor retinal activity.
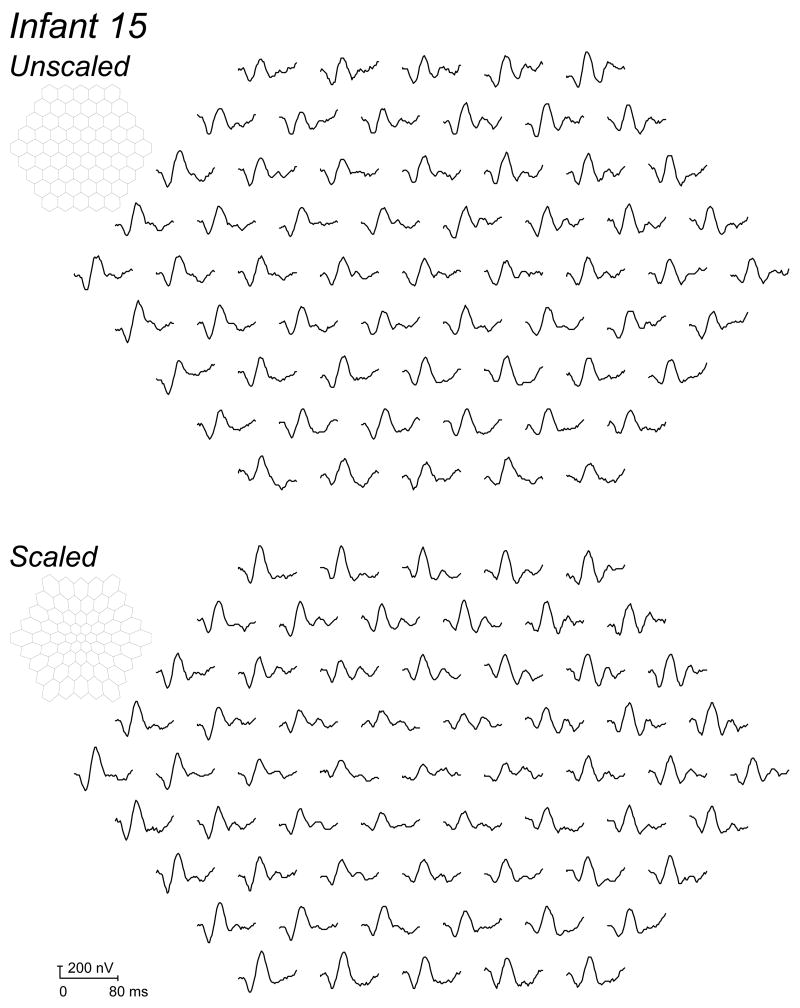
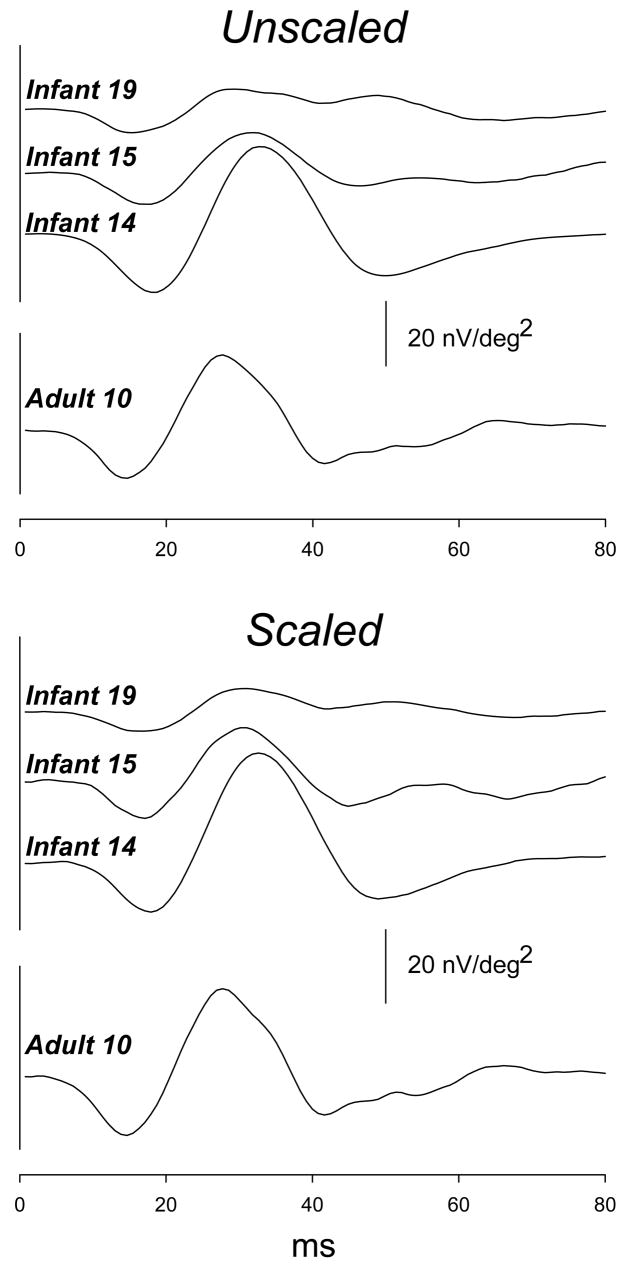
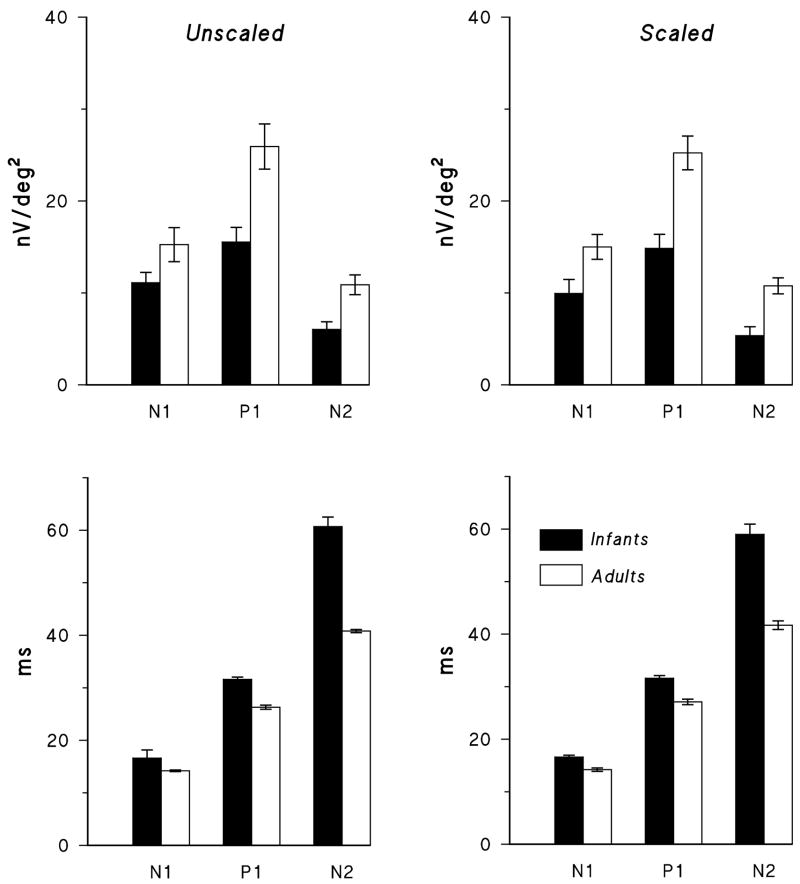
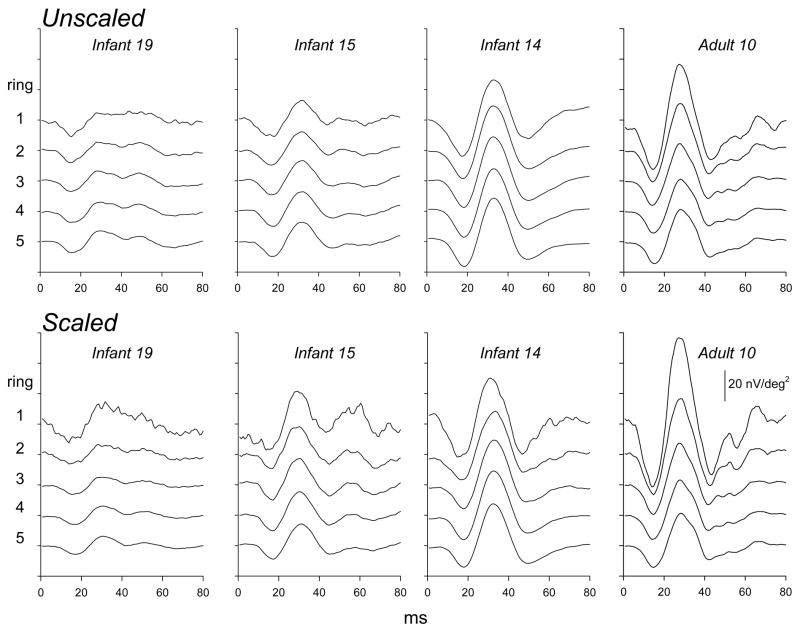
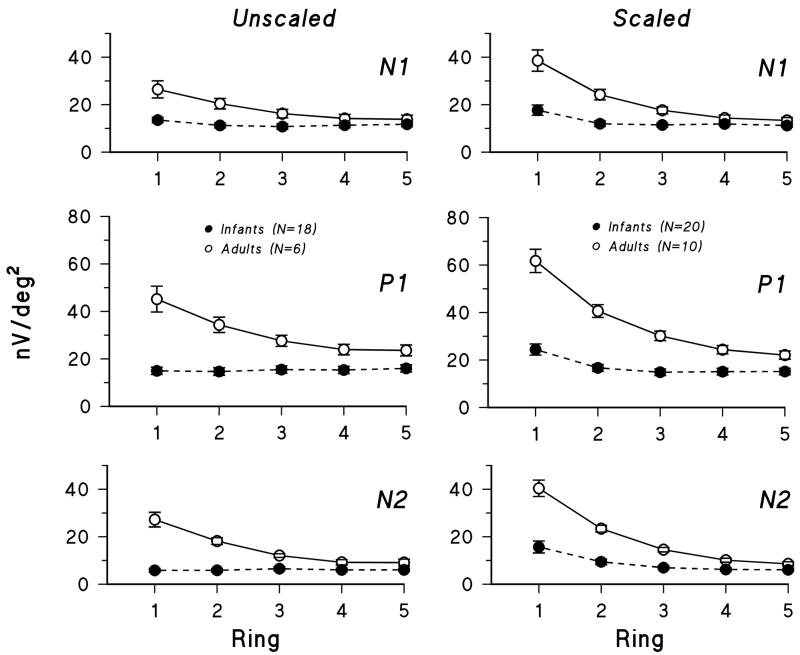
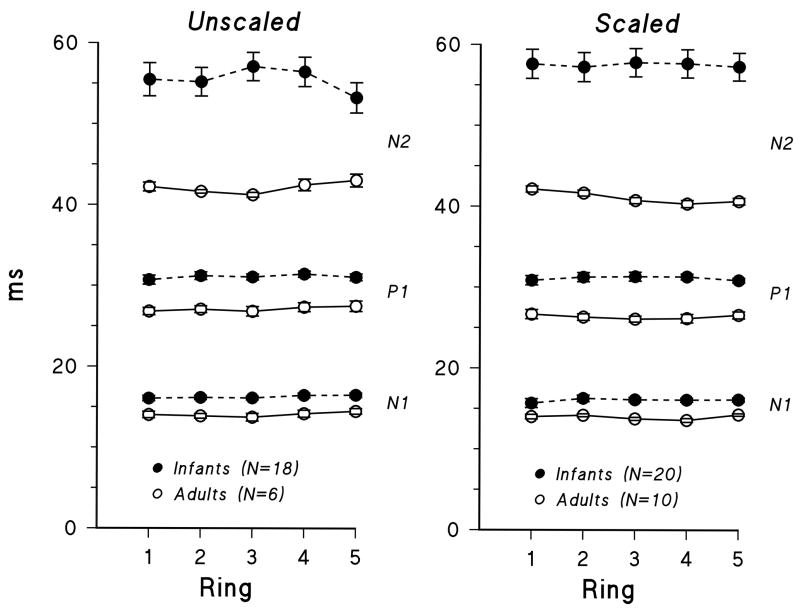
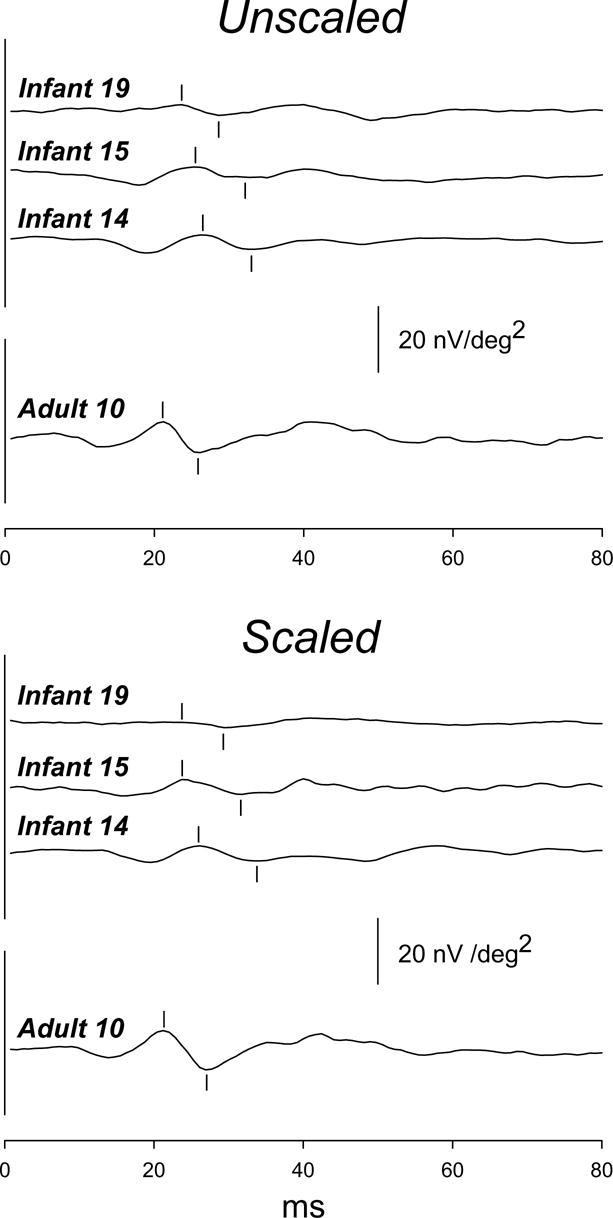
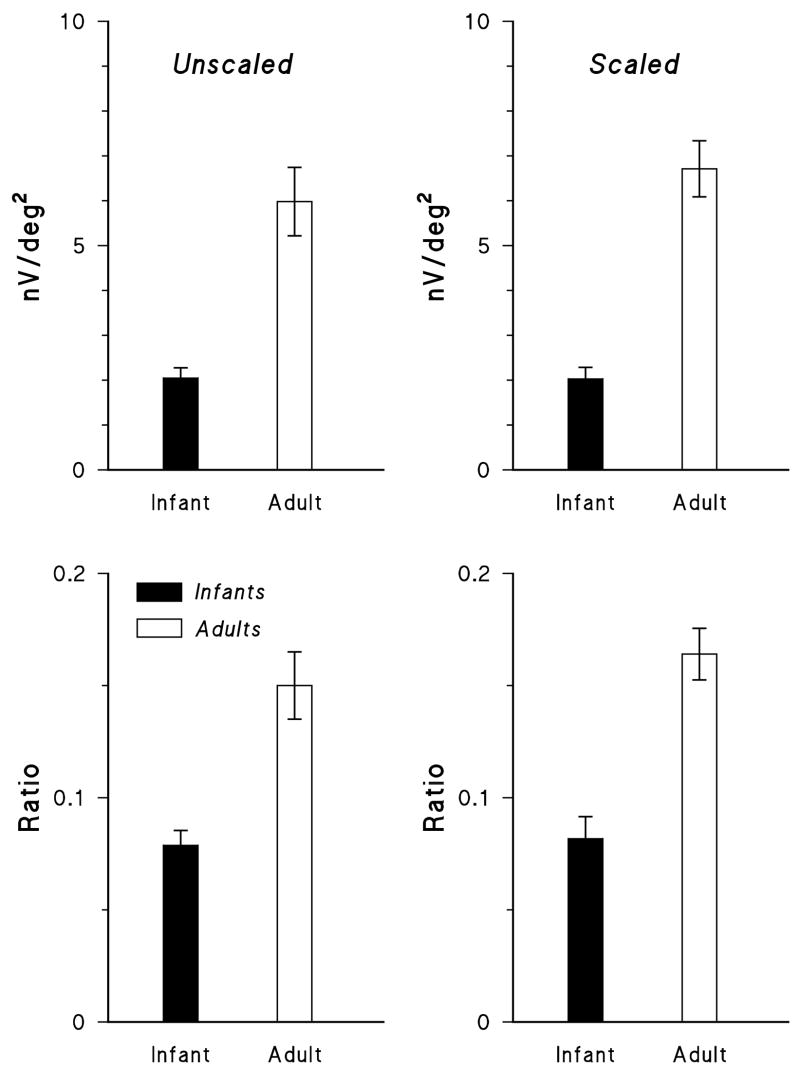
Methods: In infants (n = 23) and adults (n = 10), mfERG responses to both unscaled and scaled 61 hexagon arrays were recorded. Amplitude and implicit time of negative (N(1), N(2)) and positive (P(1)) peaks of the first-order kernel were examined. The response from the entire area stimulated and responses to concentric rings were analyzed separately. The overall averaged response of the first slice of the second-order kernel was also evaluated. Results from infants and adults were compared.
Results: Amplitudes of the infants' responses (N(1), P(1), N(2)) were significantly smaller and implicit times were significantly longer than those of adults. In infants, amplitude and implicit time varied little with eccentricity. In adults, amplitude decreased with eccentricity, whereas implicit time varied little. In infants, the second-order kernel was relatively more attenuated than the first-order kernel.
Conclusions: The infants' mfERG responses indicated immaturities of processing in the central retina. Infant-adult differences in the distribution of cones and bipolar cells may account for the results.
Figures
Similar articles
-
Changes in first- and second-order multifocal electroretinography in idiopathic macular hole and their correlations with macular hole diameter and visual acuity.Graefes Arch Clin Exp Ophthalmol. 2010 Apr;248(4):477-84. doi: 10.1007/s00417-009-1165-8. Epub 2009 Aug 13. Graefes Arch Clin Exp Ophthalmol. 2010. PMID: 19672613
-
Multifocal ERG Responses in Subjects With a History of Preterm Birth.Invest Ophthalmol Vis Sci. 2017 May 1;58(5):2603-2608. doi: 10.1167/iovs.17-21587. Invest Ophthalmol Vis Sci. 2017. PMID: 28494494 Free PMC article.
-
First and second-order kernel multifocal electroretinography abnormalities in acute central serous chorioretinopathy.Doc Ophthalmol. 2008 Jan;116(1):29-40. doi: 10.1007/s10633-007-9075-8. Epub 2007 Aug 29. Doc Ophthalmol. 2008. PMID: 17762944
-
Multifocal electroretinography in type 2 idiopathic macular telangiectasia.Graefes Arch Clin Exp Ophthalmol. 2013 May;251(5):1311-8. doi: 10.1007/s00417-012-2191-5. Epub 2012 Nov 6. Graefes Arch Clin Exp Ophthalmol. 2013. PMID: 23129007
-
Assessing retinal function with the multifocal technique.Prog Retin Eye Res. 2000 Sep;19(5):607-46. doi: 10.1016/s1350-9462(00)00013-6. Prog Retin Eye Res. 2000. PMID: 10925245 Review.
Cited by
-
Macular function measured by binocular mfERG and compared with macular structure in healthy children.Doc Ophthalmol. 2015 Dec;131(3):169-76. doi: 10.1007/s10633-015-9513-y. Epub 2015 Oct 18. Doc Ophthalmol. 2015. PMID: 26476926
-
Development of rod function in term born and former preterm subjects.Optom Vis Sci. 2009 Jun;86(6):E653-8. doi: 10.1097/OPX.0b013e3181a6a237. Optom Vis Sci. 2009. PMID: 19483509 Free PMC article. Review.
-
Visual Field Tests: A Narrative Review of Different Perimetric Methods.J Clin Med. 2024 Apr 23;13(9):2458. doi: 10.3390/jcm13092458. J Clin Med. 2024. PMID: 38730989 Free PMC article. Review.
-
The neural retina in retinopathy of prematurity.Prog Retin Eye Res. 2017 Jan;56:32-57. doi: 10.1016/j.preteyeres.2016.09.004. Epub 2016 Sep 23. Prog Retin Eye Res. 2017. PMID: 27671171 Free PMC article. Review.
-
The neurovascular retina in retinopathy of prematurity.Prog Retin Eye Res. 2009 Nov;28(6):452-82. doi: 10.1016/j.preteyeres.2009.06.003. Epub 2009 Jun 27. Prog Retin Eye Res. 2009. PMID: 19563909 Free PMC article. Review.
References
-
- Hendrickson A, Yuodelis C. The morphological development of the human fovea. Ophthalmology. 1984;91:603–612. - PubMed
-
- Yuodelis C, Hendrickson AE. A qualitative and quantitative analysis of the human fovea during development. Vision Res. 1986;26:847–855. - PubMed
-
- Mayer DL, Beiser AS, Warner AF, Pratt EM, Raye KN, Lang JM. Monocular acuity norms for the Teller acuity cards between ages 1 month and 4 years. Invest Ophthalmol Vis Sci. 1995;36:671–685. - PubMed
-
- Wali N, Leguire LE. The photopic hill: a new phenomenon of the light adapted electroretinogram. Doc Ophthalmol. 1992;80:335–45. - PubMed
Publication types
MeSH terms
Grants and funding
LinkOut - more resources
Full Text Sources
